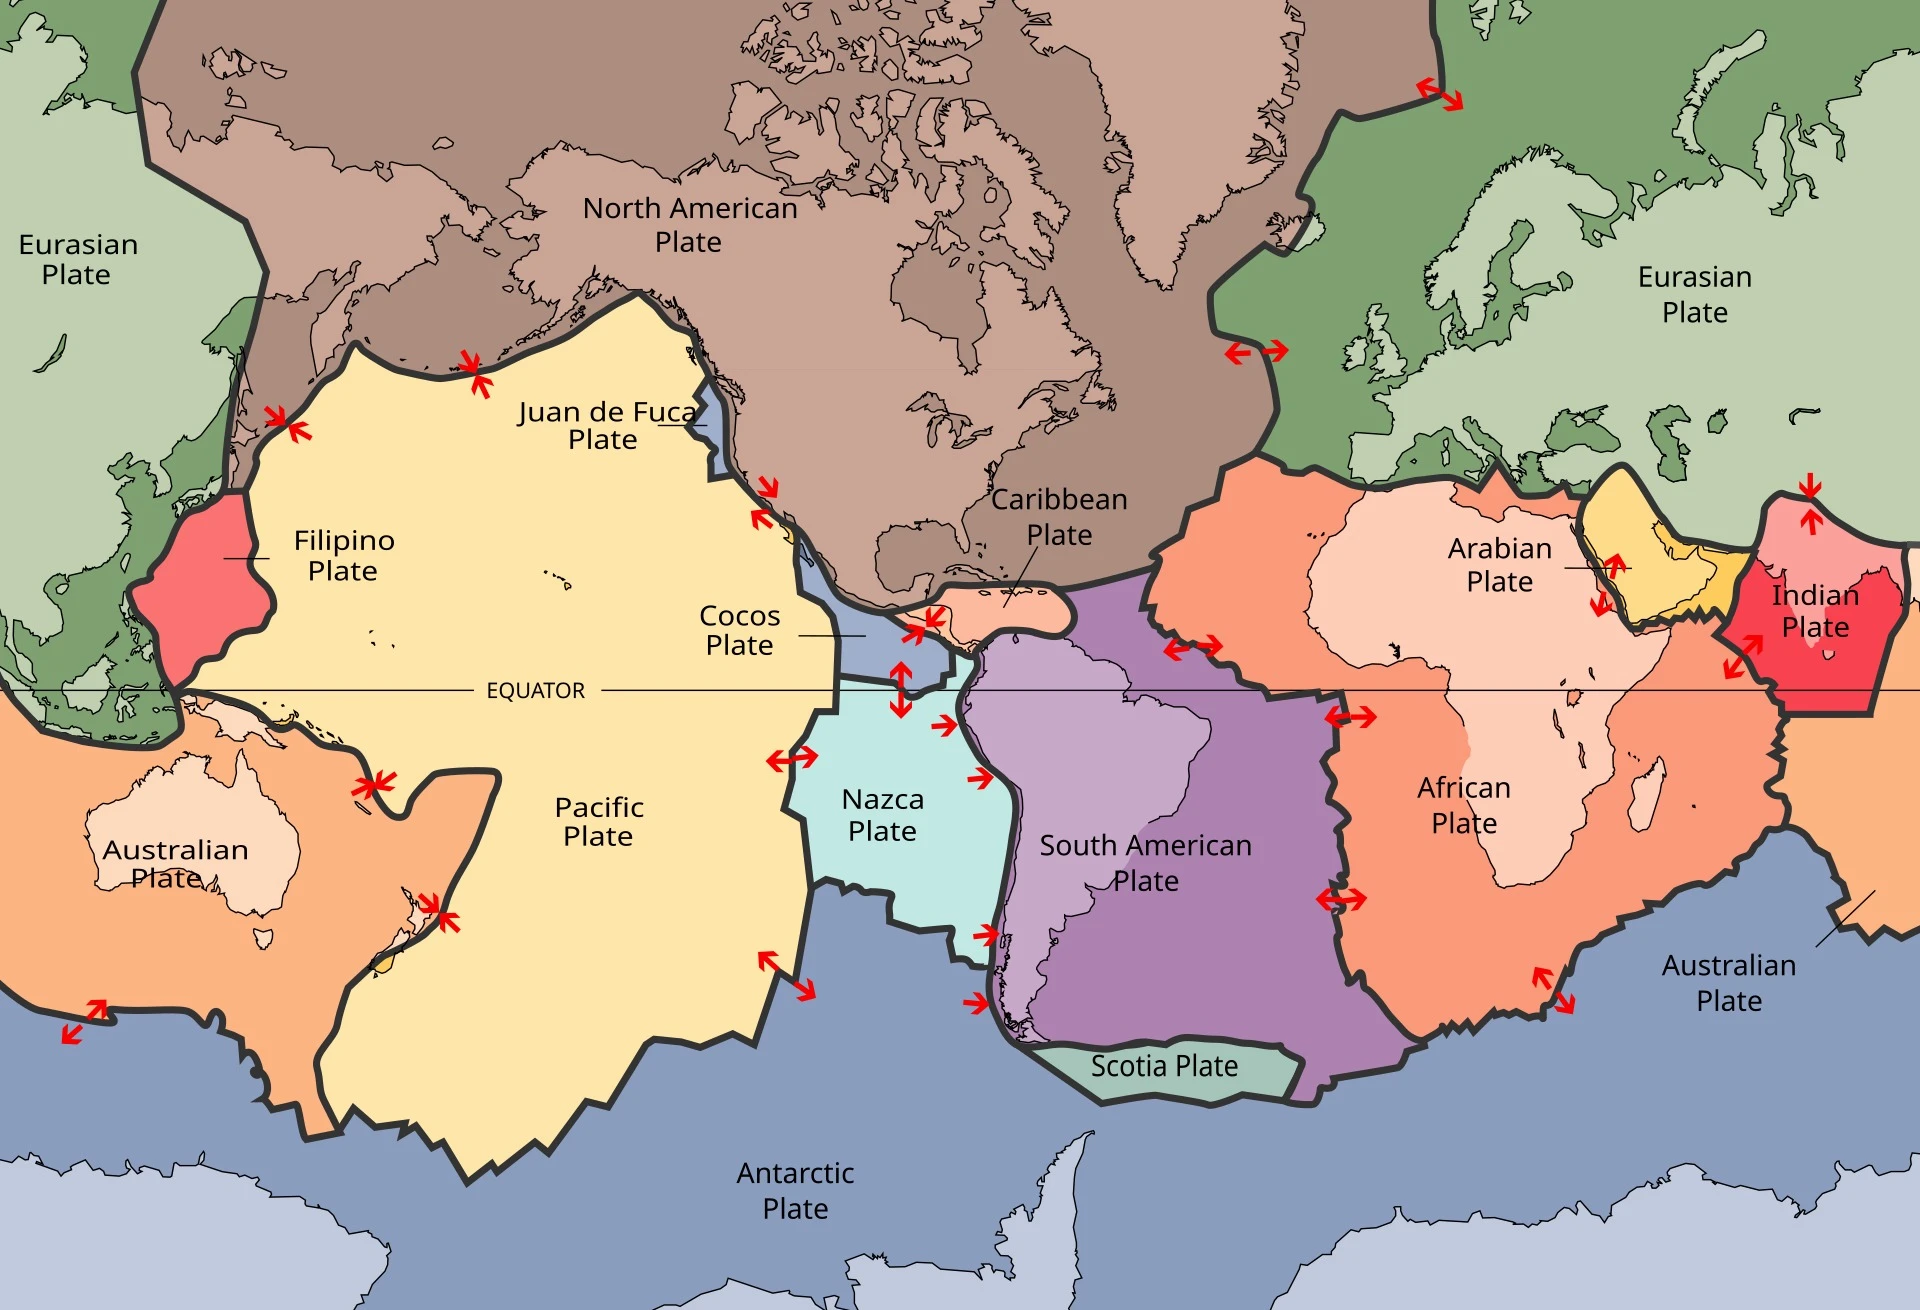
Did the Earth's plates make the moves that ZetaTalk called the 7 of 10? The forecast is precise enough to draw on a map. The line starts at Hangzhou, on the coast of China, and runs due east. South of it, in the forecast, the land tilts down. Southern China loses 20 feet. The Philippines lose 40. Java and the islands of the Banda Sea, at the tip of what ZetaTalk calls the tongue of the plate, lose "a full 80 feet in elevation, sinking many coastal cities and small islands out of sight."
Then the Pacific folds. South America rolls 250 miles west. The Atlantic tears. Africa twists in place and the floor of the Mediterranean drops. Japan shakes, the New Madrid fault in the American heartland gives way, and a wave 200 to 300 feet high runs toward Europe.
Nancy Lieder's site, ZetaTalk, set this down in 2010, in the words of beings she calls the Zetas. In April that year they gave it a date: "We have stated that the Earth will be at a 7 of 10 by year end, and that a 7 would constitute something that would shock the world."
Within three years, the site was giving each move a percentage.
Where Did the 7 Come From?
The scale came first. On 22 March 2008 a reader asked how much worse the Earth's changes would get that year, on a scale of 1 to 10. The answer: "If you consider that you are perhaps between a 2 and a 3, it could be considered to rise to a 6 by the end of the year. 10 being the pole shift, of course."
The 7 came from a vision. In November 2009, the site says, Nancy Lieder was given a holographic presentation: Africa rolling, India tipping, the islands of Indonesia sinking, the Andes rising, the Atlantic ripping open and a tide rushing at Europe. The Zetas confirmed it on 5 December 2009: "the changes described in the vision are closely associated with a move to a 7, yes."
Then the detail poured out. Between 2008 and 2012 the site posted 108 pages on the 7 of 10 alone, each dated, each answering a reader. Figures came with them. Gibraltar would open "an additional 125 miles." Japan would suffer quakes "truly in the scale of a 9."
In the autumn of 2010 came the order, five lines long: Indonesia sinking; the Pacific folding so South America can roll; the south Atlantic tearing so Africa can roll; "great quakes in Japan followed by the New Madrid adjustment, which is followed almost instantly by the tearing of the north Atlantic Rift with consequent European tsunami."
The timing was the one thing withheld. "We are not allowed to give a time frame for any of these plate movements," the same page says. But the year was already set. In October 2010 a reader asked whether it was another white lie. The answer: "But what would be the advantage of a failure on the 7 of 10 prediction?" And: "There would be no gain."
How would anyone know it had come? The Zetas had answered that in November 2009: "You will know when we have arrived at a 7, without question."
Five Lines, Ten Steps
The Zetas named the precursors in advance. Bangladesh sinking, the Coral Sea floor rising, Pakistan flooded and not draining, "while Jakarta on the tongue of Indonesia is also sinking rapidly, showing that the tilt that will allow Indonesia to sink has already started." The cause, on their account, is the incoming planet jerking the Earth around: "This has the effect of jerking the Earth plates against each other, so they move."
What would the first weeks look like? On 18 December 2010: "It will be a steady sinking, in short bursts, over a 2-3 week period."
And the site reported that it began. From 23 December 2010, it said, "sinking along the southern coast of Java was evident." On 8 January 2011: "The Philippines have begun to sink." The floods across Queensland that month were read as the Indo-Australian plate tipping. Its summary page records the arrival: "In 2011 we have arrived at a 7 out of 10."
The sinking, the Zetas said, would be hidden in plain sight, "covered by claims of high tides and storms." Quake magnitudes would be held down by "the USGS coverup on quake magnitude."
By 2019 the five lines had become ten numbered steps, and the steps had percentages. Indonesia's sinking stood at 70 per cent in February 2013, 93 in March 2015, 98 in November 2019, 100 by 2022. South America's roll went from 13 per cent to 100. New Madrid, step 9, was "frozen at 36%" at the end of 2020, then 68, 83, and 92 per cent in May 2023.
Undulating, Slowed, Ordered to Catch Up
Three weeks became a year. In January 2011 the plates were "undulating," and the Zetas asked themselves, "How did we miss this, that undulation might occur?" By February 2012 there were machines: alien "humming boxes" along the coastlines, there "to abort sudden and jolting plate movements." In the thousands. Most under water. By May 2012 the Zetas wrote it plainly: "the Sunda Plate sinking would occur within 2-3 weeks, yet it dragged on through 2011."
From 2014 the reason widened: the pace had been slowed "to give Obama and his partners a chance to admit the presence of Nibiru." In December 2023 that delay ended: "Thus the Council was ordered to catch up."
And the step in Japan, the one meant to come before New Madrid? In March 2011 the Tohoku earthquake was "not the start of the Japan 7 of 10 events." In November 2019 New Madrid would be set off from elsewhere, "since Fukushima negated the need for Japan [8] involvement." By 2022 Japan stood at 100 per cent.
In 2014 the Zetas set the 7 of 10 before the end: "the 7 of 10 has hardly completed, so how can the Last Weeks be commencing?" In 2024 they said the 8 of 10 had "already started," overlapping the 7. The site now counts toward a passage it puts in February 2027, set out in ZetaTalk's Last Weeks.
If the Plates Are Moving
Set aside for a moment whether it is true. Ask the better question. What kind of world would this be if it were?
It would mean the ground under the cities of Java is a slope, already tipping. The coastlines on every atlas would be a snapshot, and the next edition would show cities that are now under the sea.
It would mean the oceans have been held back. Machines in the thousands, most of them underwater, damping the jolts that would have come. Which would mean our planet's surface has been managed for over a decade by hands that are not human, and the earthquakes we did not have are as much a part of the record as the ones we did.
It would mean the map of our species is temporary. Our cities crowd the low coasts, the river deltas, the plains beside the Mississippi, because for all of recorded history the ground there has held still. On this reading it would be about to stop holding still.
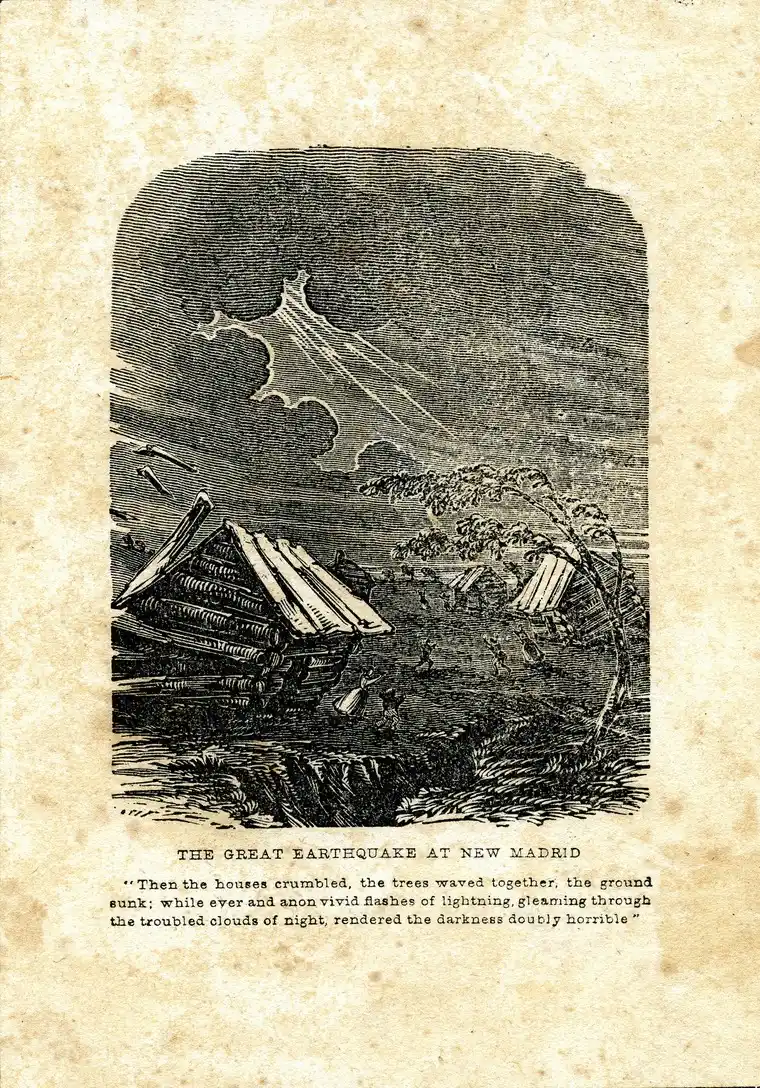
And it would mean one step is still waiting. The New Madrid fault, under the farms of Missouri and Tennessee, would be the last great move of the 7 of 10, and it would pull the Atlantic open behind it. A coast on the far side of an ocean would be tied, by a single sequence, to a fault under farmland it has never heard of: the whole surface of the planet one connected machine, each part answering the others.
What would a map of the world look like, drawn the year after?
Millimetres a Year
How fast do plates move, and who is measuring? The standard account starts there. The United States Geological Survey puts their pace plainly: they move "roughly at the same rate that your fingernails grow," and satellite positioning measures that motion "within a fraction of a millimeter per year." The Nevada Geodetic Laboratory alone processes data from more than 17,000 GPS stations, and anyone can download it.
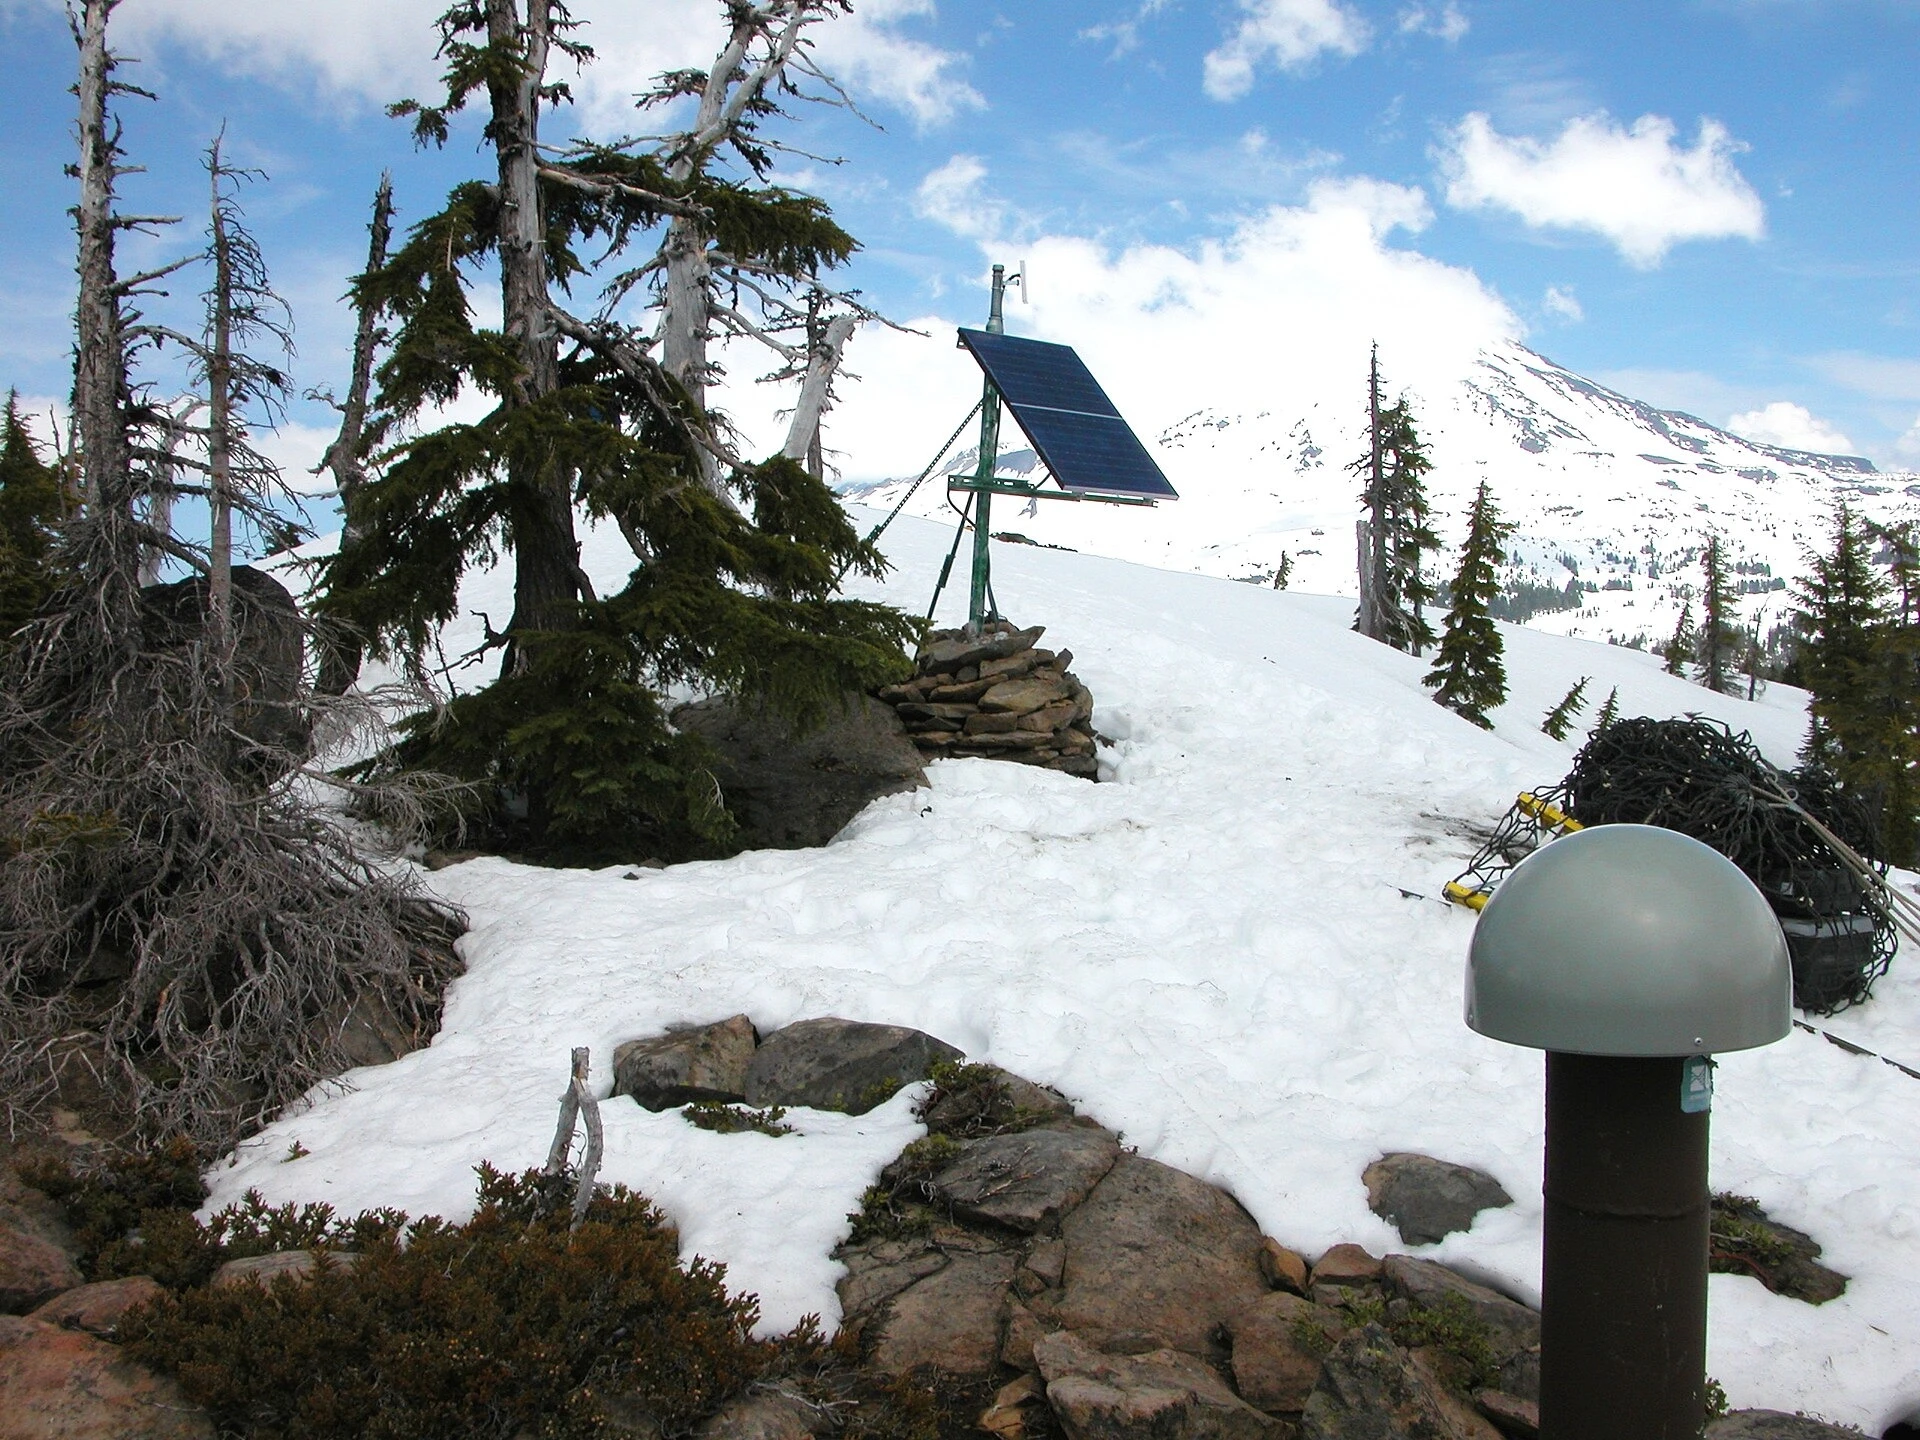
For Southeast Asia, a study of more than 100 GPS sites from 1994 to 2004, published by Wim Simons and colleagues in 2007, found the Sunda block moving east at 6 to 10 millimetres a year, with internal deformation "very small."
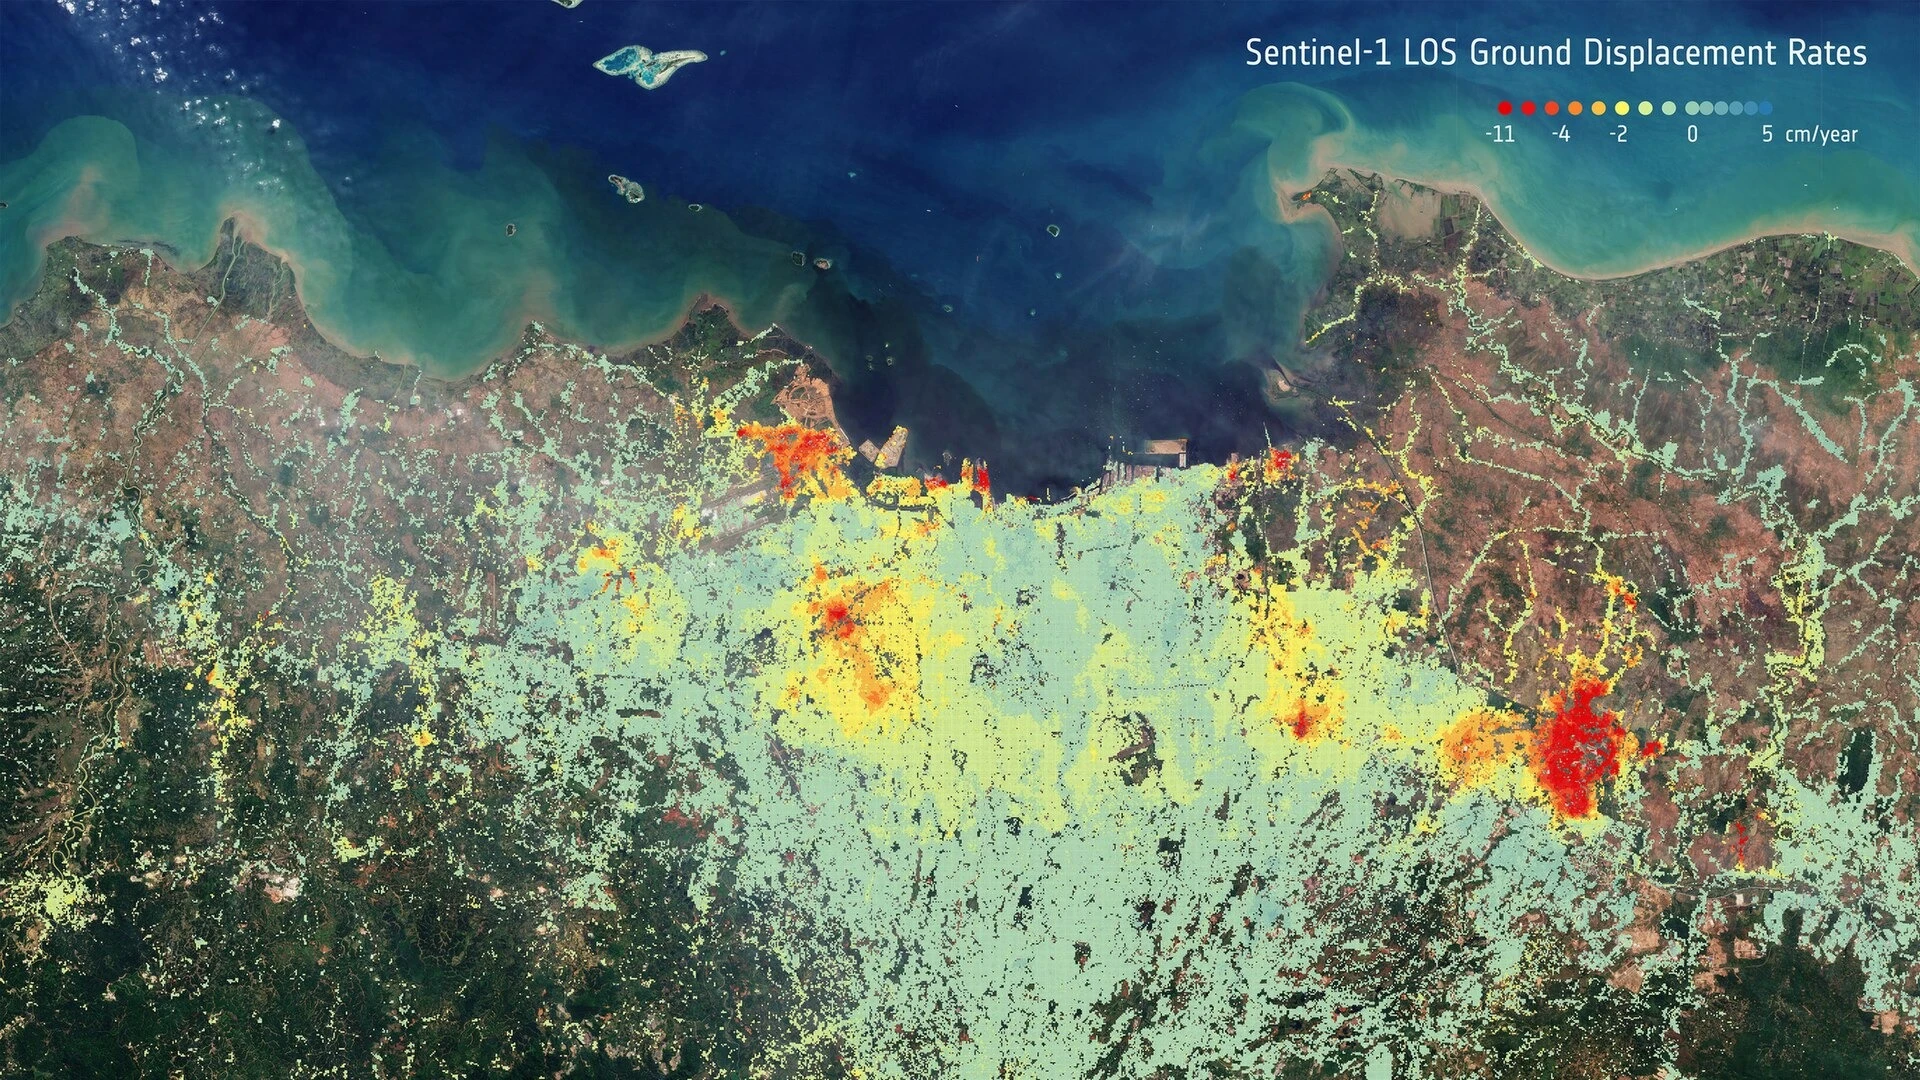
Jakarta is sinking. Geodesists led by Hasanuddin Abidin, measuring from 1982 to 2014 by levelling, GPS and satellite radar, found typical rates of 3 to 10 centimetres a year, varying from place to place and faster on the coast. They named the causes as "excessive groundwater extraction," soft alluvial soil, the weight of buildings, and tectonic activity.
At New Madrid, a GPS study by Eric Calais and Seth Stein in 2009 found the ground moving at "less than 0.2 millimeters per year." Africa's rift, Calais, Stamps and colleagues reported in 2008, opens at about 1 to 7 millimetres a year; the Mid-Atlantic Ridge, the USGS says, about 2.5 centimetres. The USGS expects about 16 major earthquakes a year and says the count is not increasing.
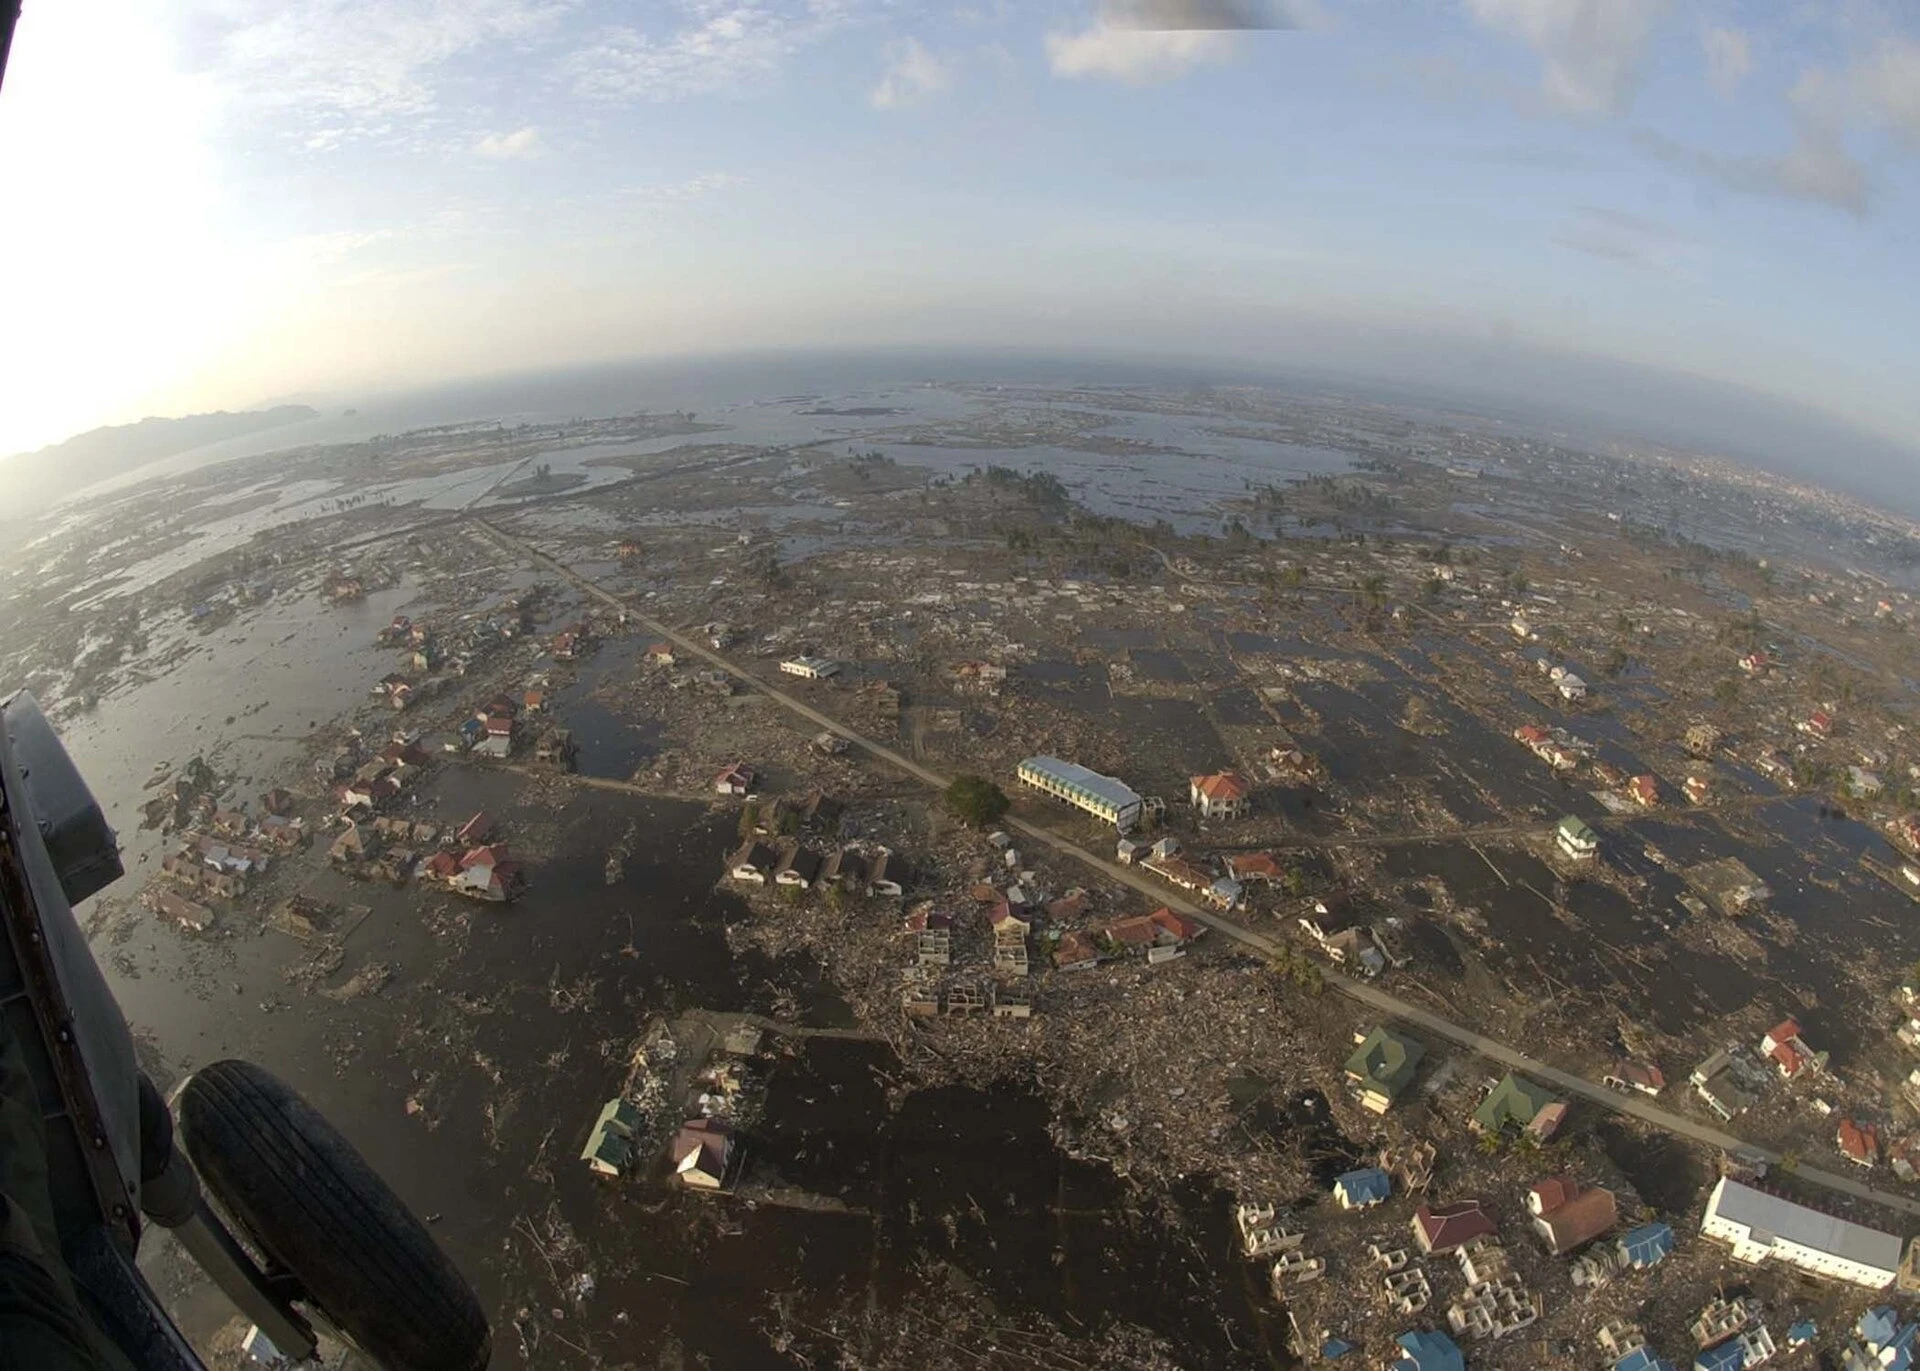
When ground does move by metres, the instruments record it. In the 2004 Sumatra-Andaman earthquake, islands moved more than 6 metres; in 2011 Japan's Oshika station moved 5.3. Both were earthquakes, local to a fault. Nothing in the published records shows the 80 feet.
Does a Quiet Fault Mean a Safe One?
Jakarta is in fact sinking, Pakistan did flood, and Queensland was under water in January 2011. The Zetas pointed at real events. The measurements give a local pattern and name local causes; on ZetaTalk's reading the same events are a plate tipping. No instrument can rule out a cause it was not built to see.
New Madrid is not quiet in the record either. The USGS, in a fact sheet of 2009, gives the chance of a magnitude 6 or larger there in the next 50 years as 25 to 40 per cent, and of a repeat of the great quakes of 1811 and 1812 as 7 to 10 per cent. It warns that the long-term processes behind them are "unlikely to switch off in a few decades." The low strain that Calais and Stein measured leaves its own question open; as Stein put it, "We can't tell whether the recent cluster of big earthquakes in the New Madrid is coming to an end."
The instruments cannot say which.
And the explanations sit where no instrument reaches. A movement slowed by machines that are cloaked, by design, looks on a GPS record like the ordinary millimetres a year.
The forecast also carries an order that outlives any date. Japan's place in it changed, but New Madrid before the Atlantic has held since 2010, and that order has not yet been run. Other sources have answered missed dates in other ways, set side by side in Parallel Timelines, and dated forecasts of this kind are gathered in the record of dated predictions.
Step Nine
What remains is one fault and one forecast. The site has counted New Madrid up to 92 per cent. Since then it has been "now starting" in April 2024, "very much pending" in March 2025, "iterative" at the end of that year and, in July 2026, "about to begin." Its own 2010 page gives the shape of it: "one large jolt with a subsequent and almost immediate tearing of the Atlantic."
That is a test anyone can watch. The New Madrid zone is, in the USGS's words, "the most seismically active area of the United States east of the Rockies," and the GPS stations around it publish their positions daily. A jolt that tears the Atlantic would not need an announcement. The same 2010 page says what would follow it: "Aftershocks will continue until the time of the pole shift itself." That would leave its mark on every seismograph in the region and on the stations' daily positions, and, if the Atlantic tore behind it, on the tide gauges along Europe's coasts.
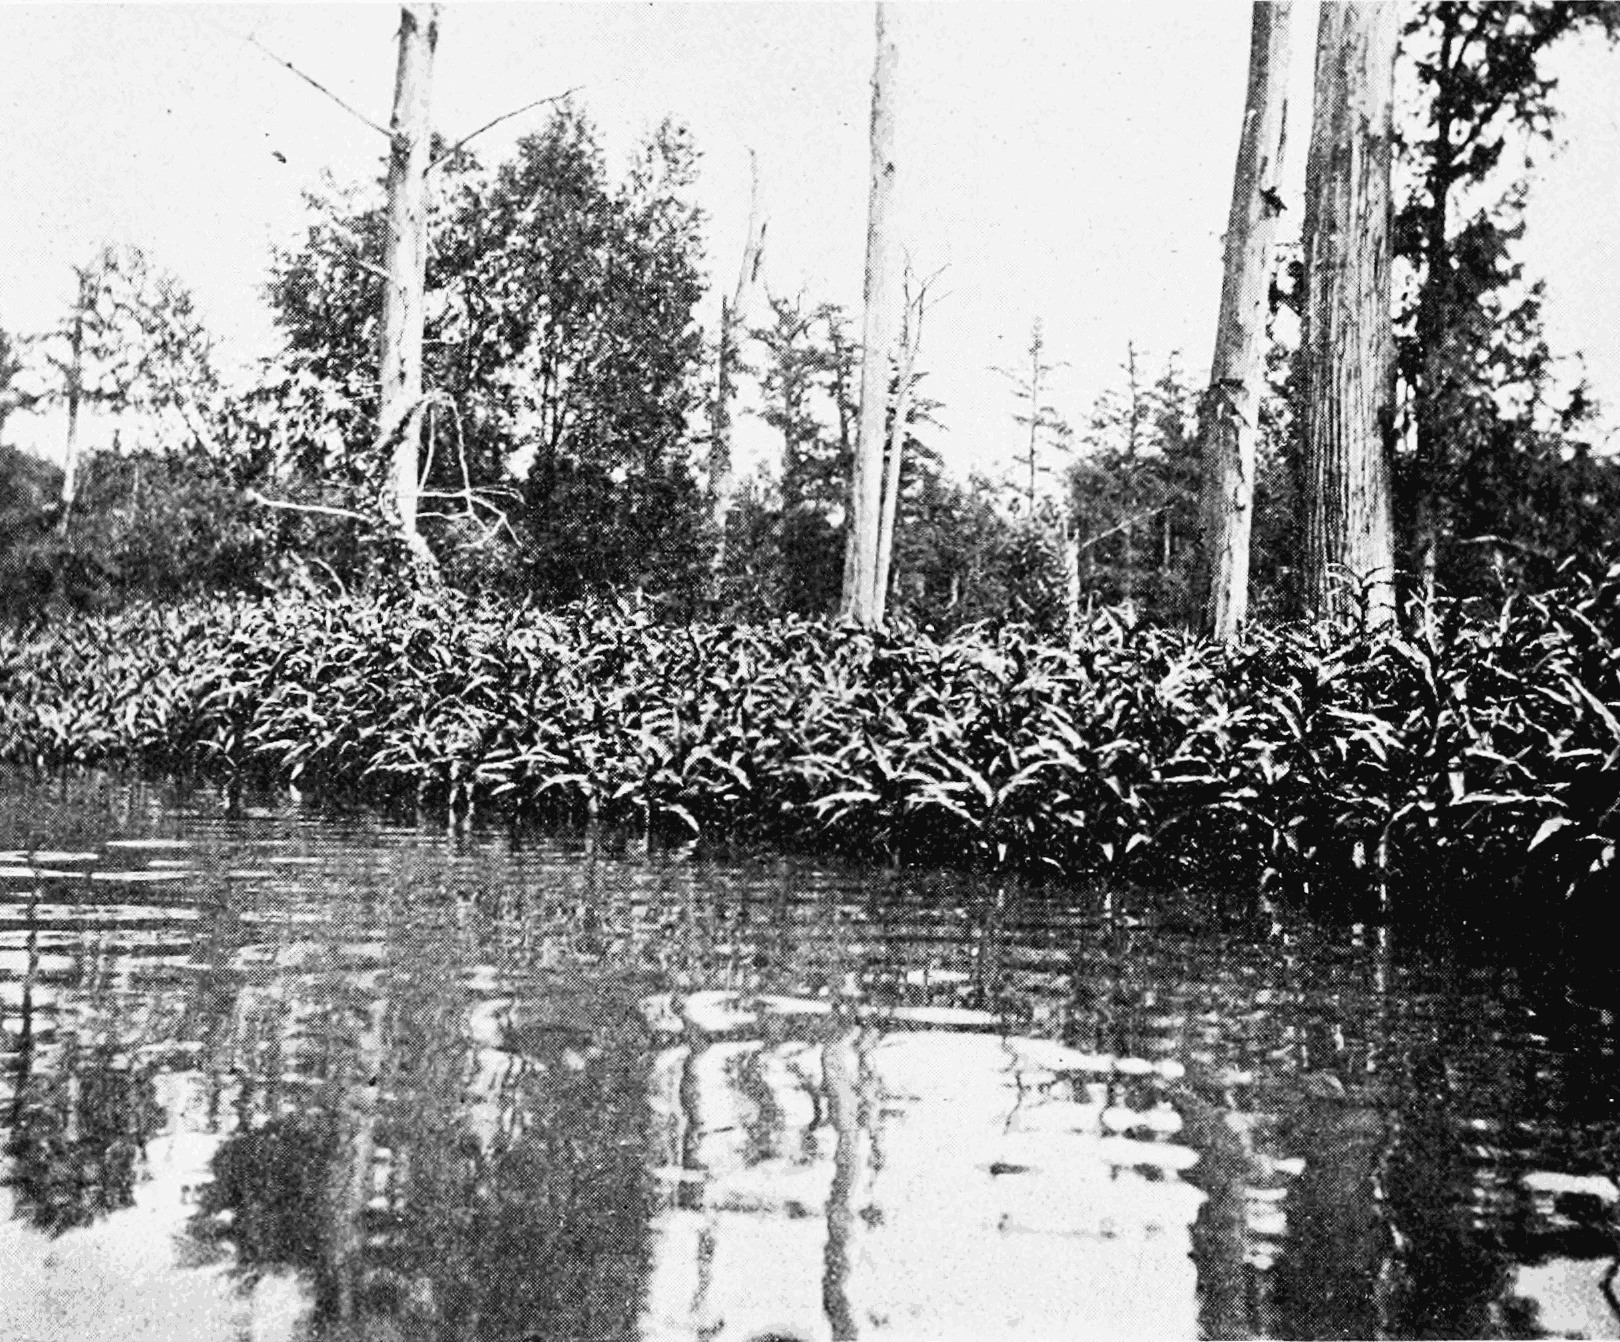
The USGS says one day there will be another large quake there. ZetaTalk says the next one completes the 7 of 10.
Only one of those two statements comes with a sequence. On the day the site calls step 9 done, what will the stations around New Madrid have recorded?
Questions This Leaves You With
Is there anything to do with a forecast that has no date?
Start with the timescale, honestly: the 7 of 10 has run sixteen years without a date that held, and the Zetas say none can be given. So nothing here asks you to change what you do. The larger question is not about you: the USGS says many structures in Memphis, St. Louis and other towns of the central Mississippi valley "are vulnerable and at risk." How ready a region is for a quake it has not felt in two centuries is a question worth asking, whoever is right about the cause.
Is a Council of Worlds slowing the plates a kind of providence?
It cuts both ways. ZetaTalk describes a Council of Worlds that slows the plates so that people have time to choose service to others, which some readers find close to providence. Others find it troubling that a source assigns every delay to a higher hand, because then no delay can count against it. Both readings are open to you. This site will not tell you which way it falls for you.
How does a lifetime measure against a moving plate?
Put your own life against the plates. The Sunda block moves under a centimetre a year: about a hand's length in the time it takes a child to grow up. On one reading that makes a life tiny, a brief visitor on ground that is always going somewhere else. On the other it makes a life remarkable, lived on a surface steady enough that whole civilizations could be built along its coasts. Which did you feel first?
What would settle the 7 of 10, one way or the other?
Name it now. Toward the claim: a GPS station on Java or in the Philippines recording a drop of metres over weeks, with no earthquake to account for it; a published coordinate set that matches one of the site's percentages. Against it: the site declaring step 9 done while the New Madrid stations show no jolt and the Atlantic stays whole; the zone still showing less than a millimetre a year of strain a decade from now. Which of those would you accept, and from whom?
Is the New Madrid fault waking up or winding down?
Nobody knows, and the scientists themselves disagree. The great quakes of 1811 and 1812 struck, as the USGS puts it, "in the middle of the vast North American tectonic plate," and the ground there barely strains. Some read the low motion as a fault zone shutting down after a cluster of quakes. The USGS reads the sand blows left by older quakes, about one great sequence every 500 years, as a hazard that has not gone away. A fault in mid-plate that stores so little strain and still produced three magnitude 7 quakes in under two months has no settled explanation.
More photographs
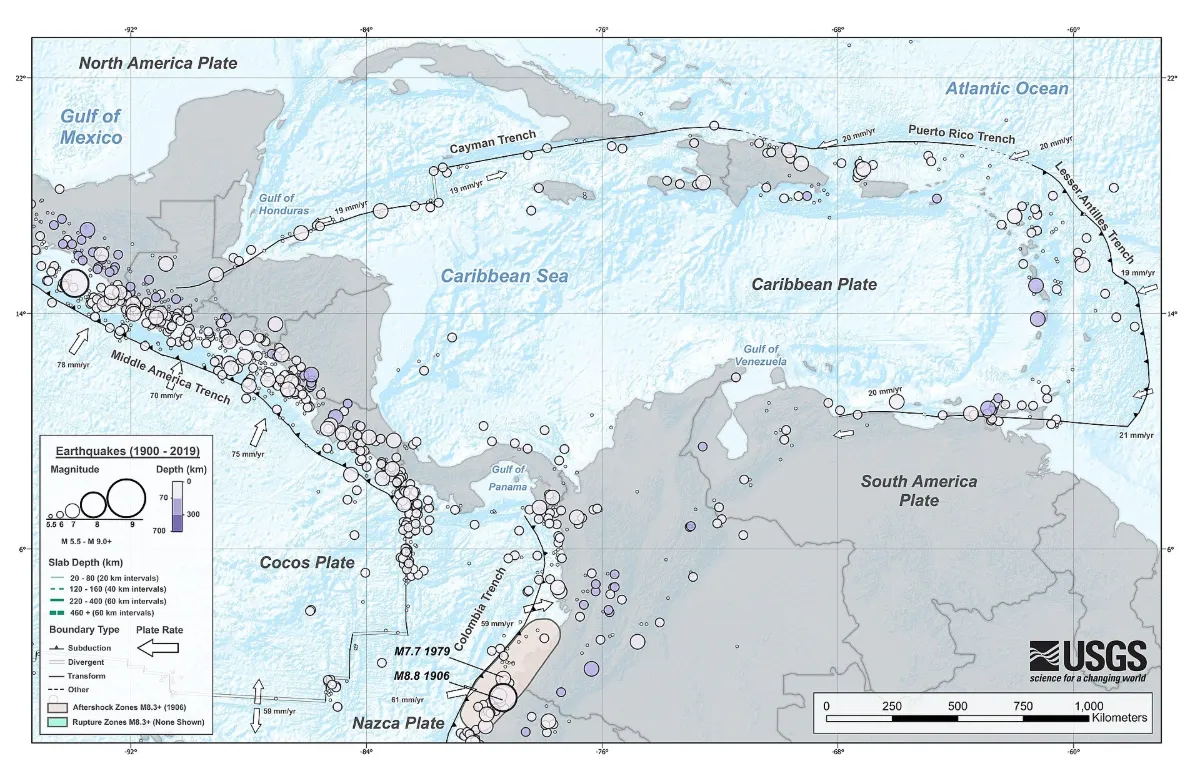
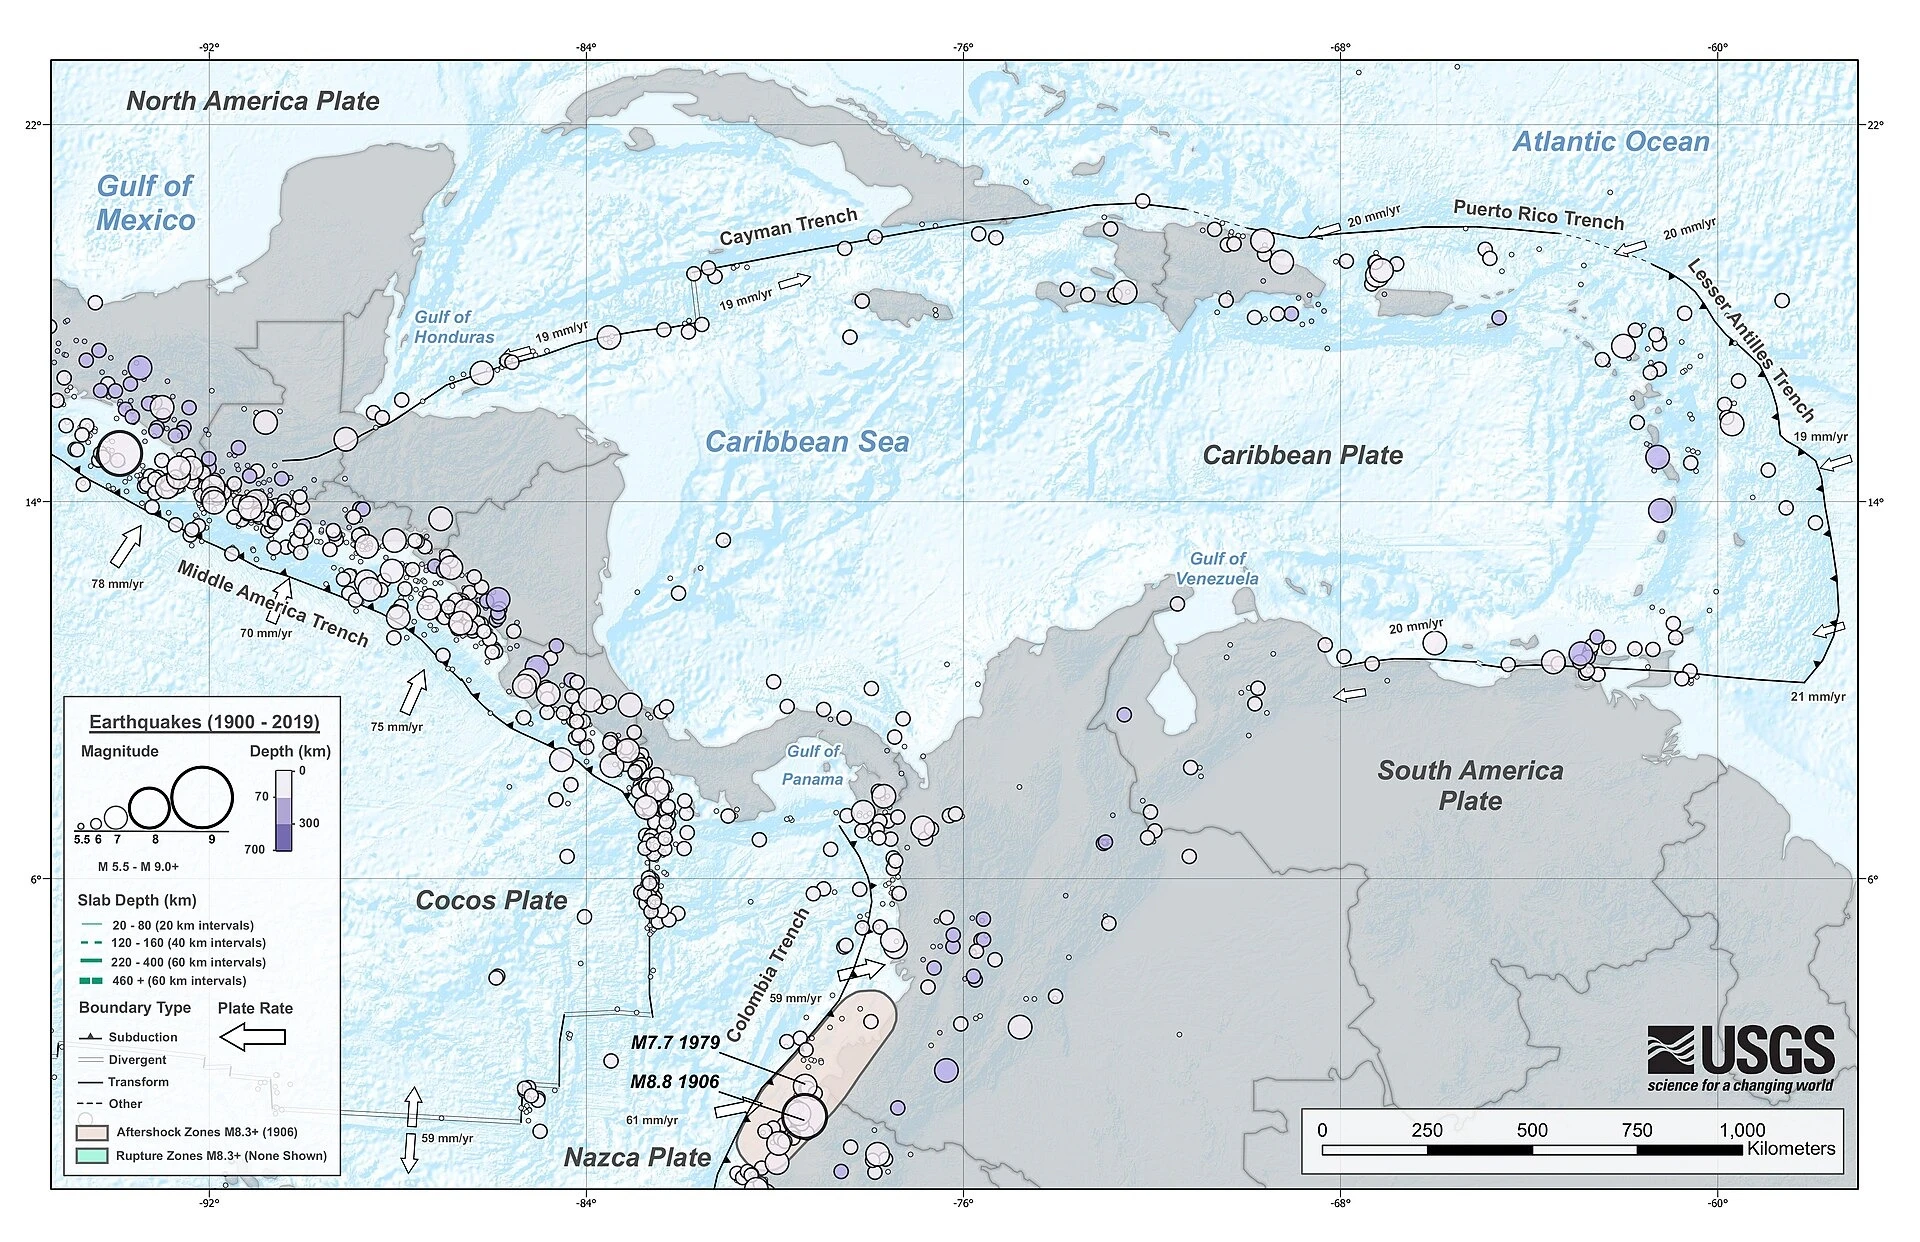
The Caribbean plate and its boundaries, with the earthquakes of 1900 to 2019, from the U.S. Geological Survey. Map: U.S. Geological Survey, public domain, via Wikimedia Commons. Resized. 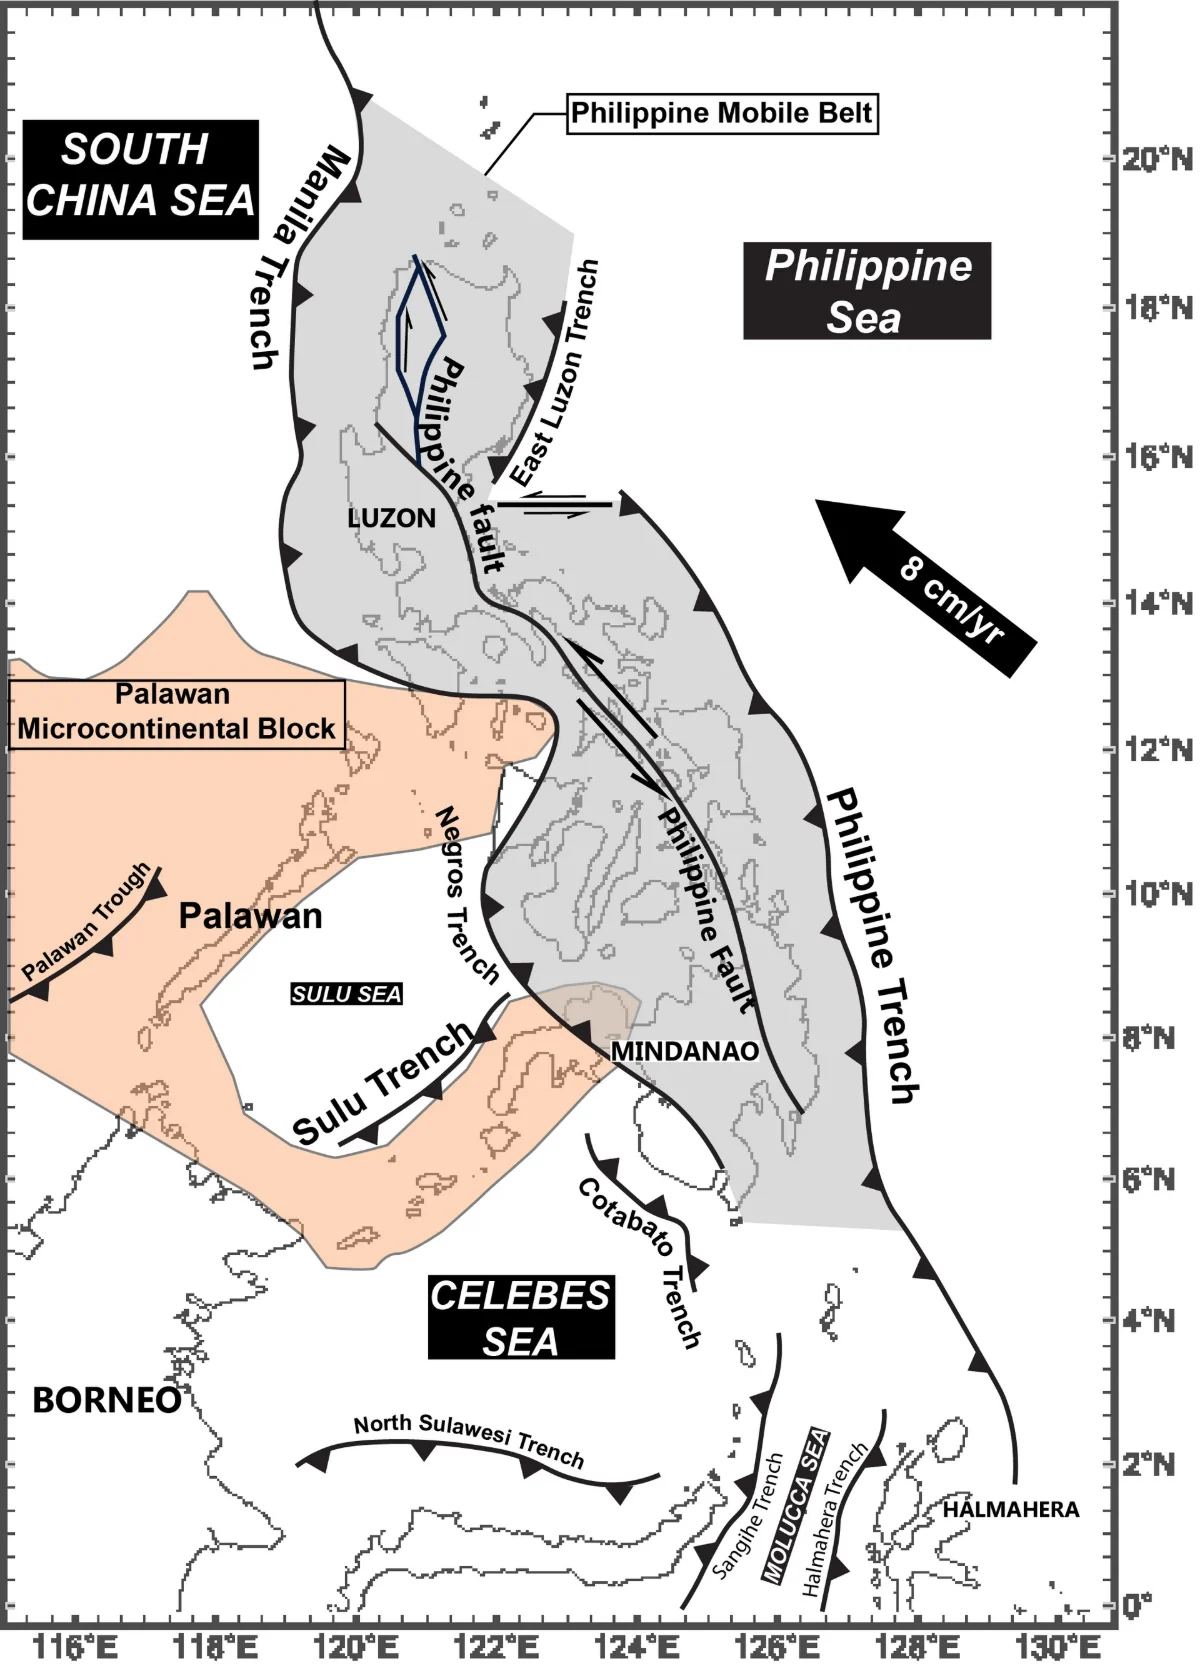
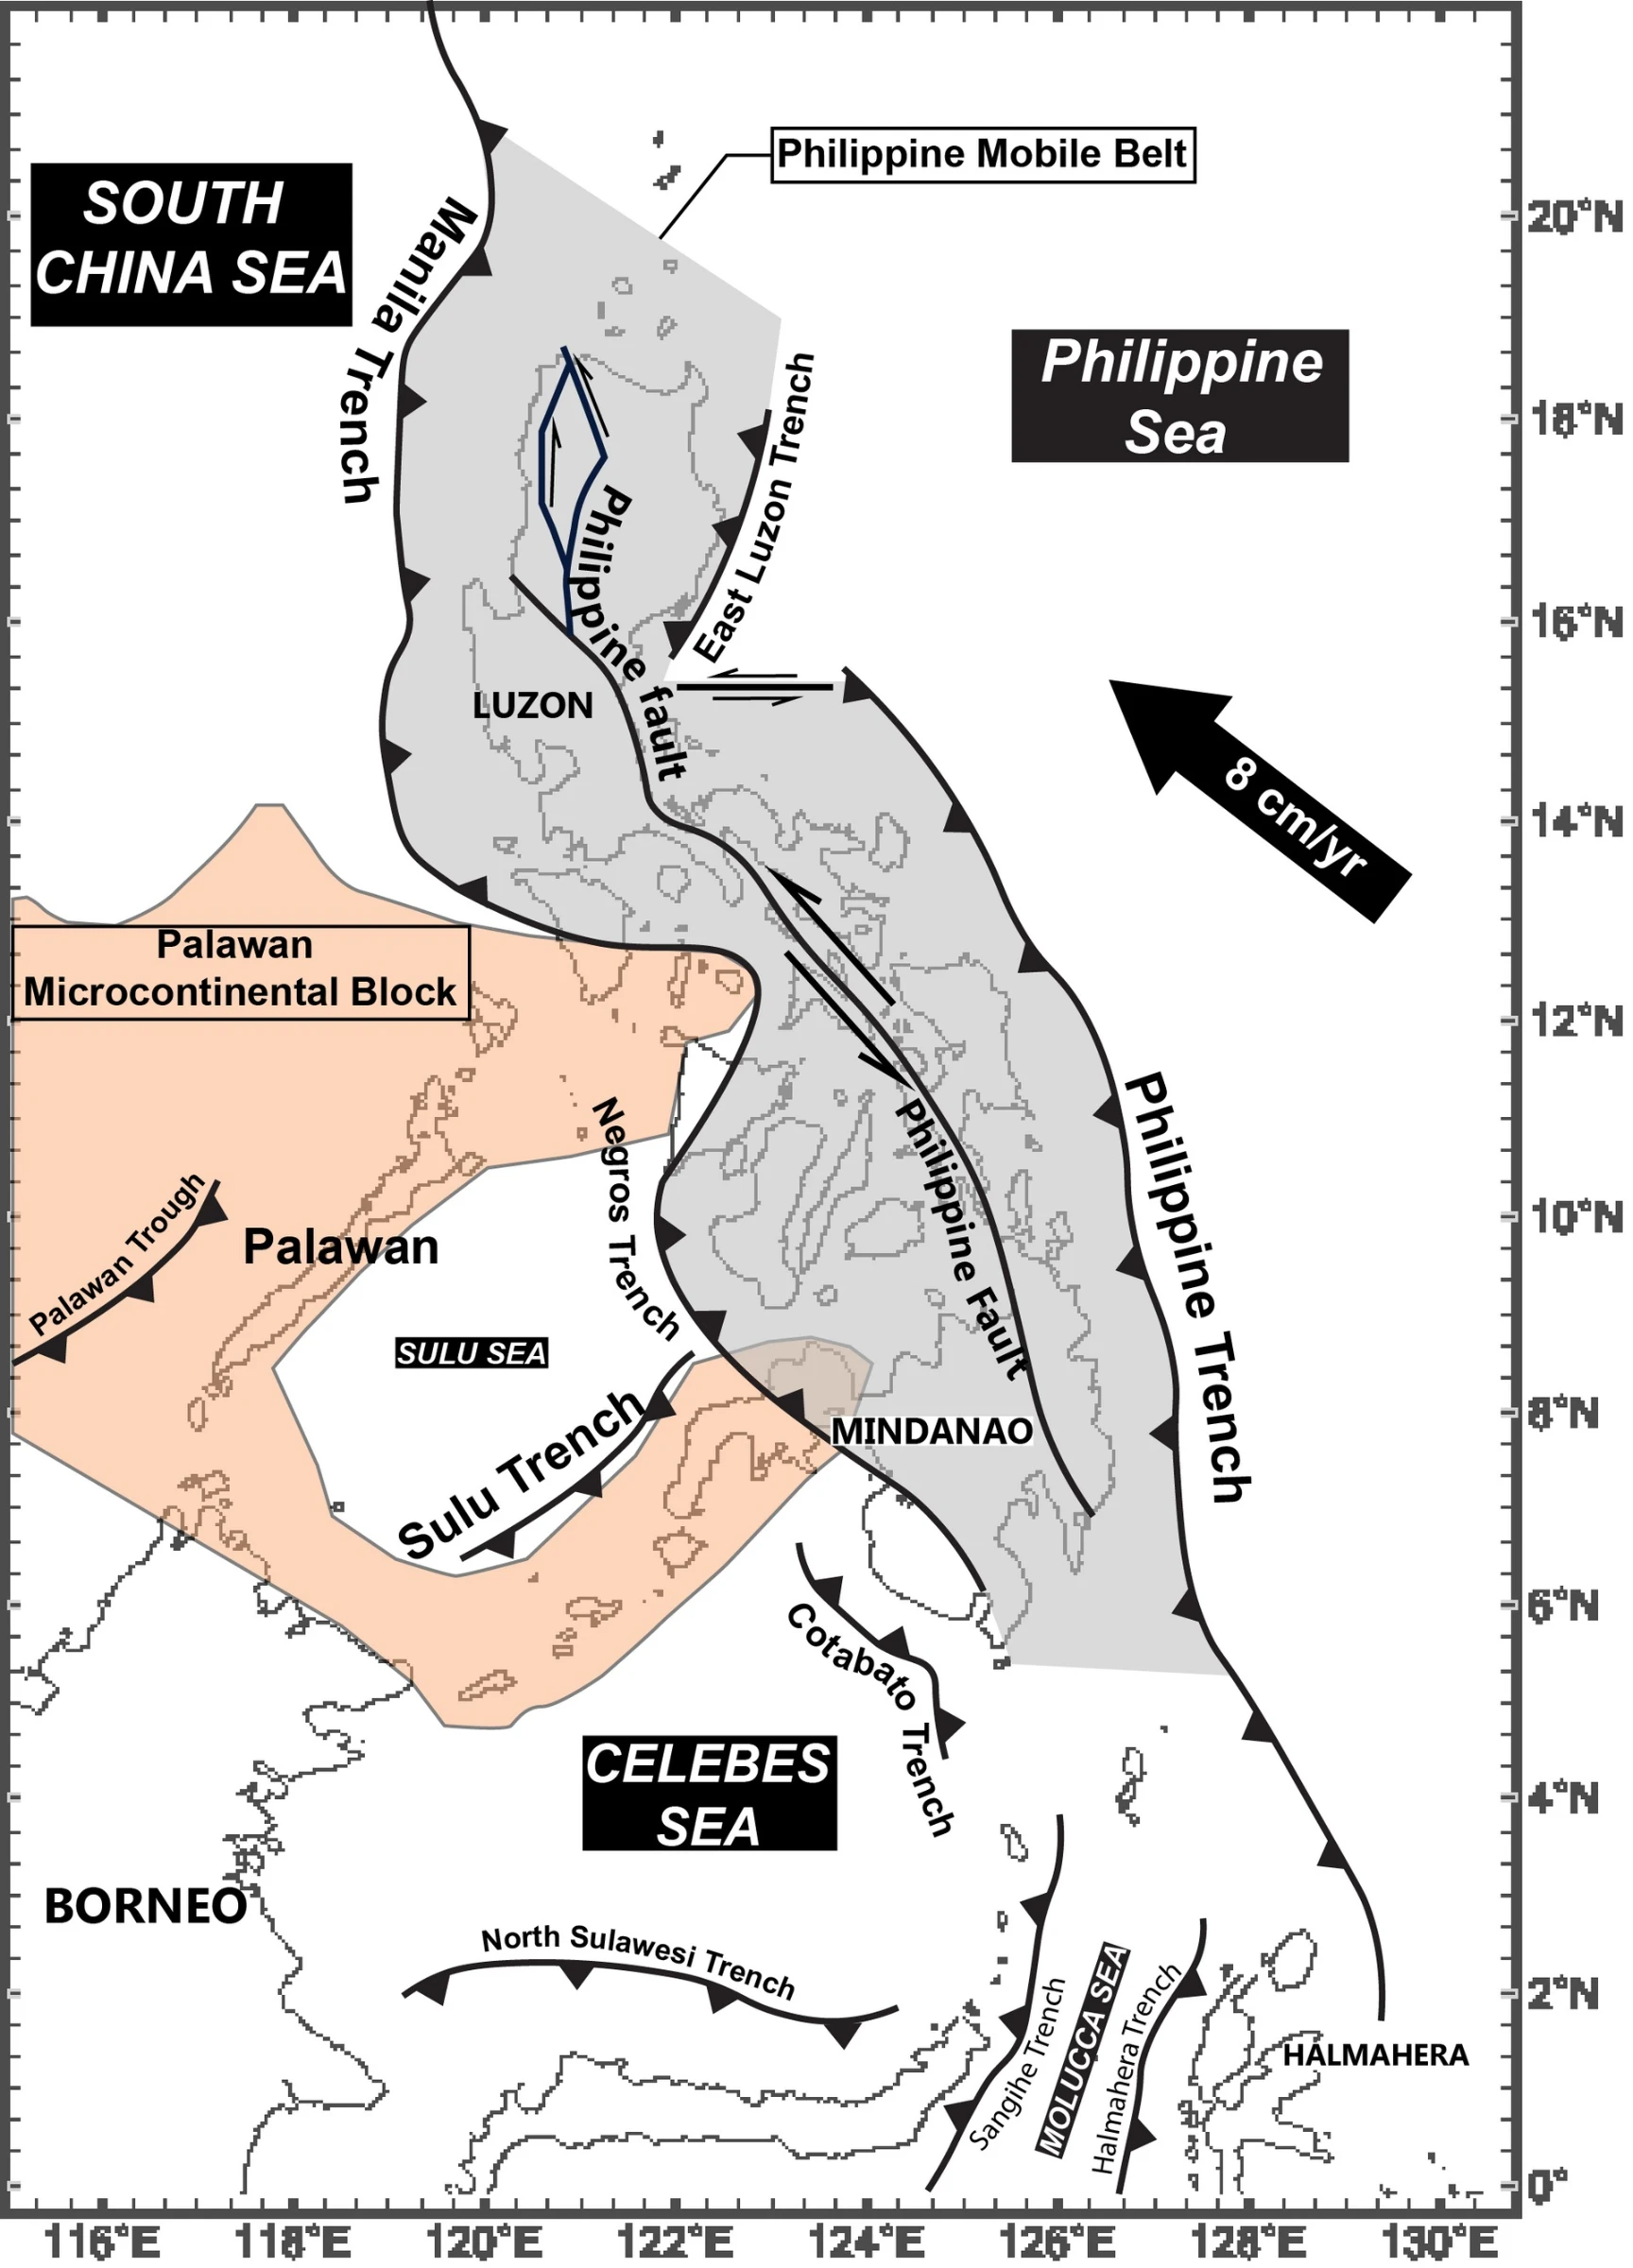
The trenches and faults around the Philippines, where the Philippine Sea plate meets Eurasia. Map: LkwkarenHKU, after David et al. 1997, Hall 1987 and Aurelio 2000, CC BY-SA 4.0 (creativecommons.org/licenses/by-sa/4.0), via Wikimedia Commons. Resized. 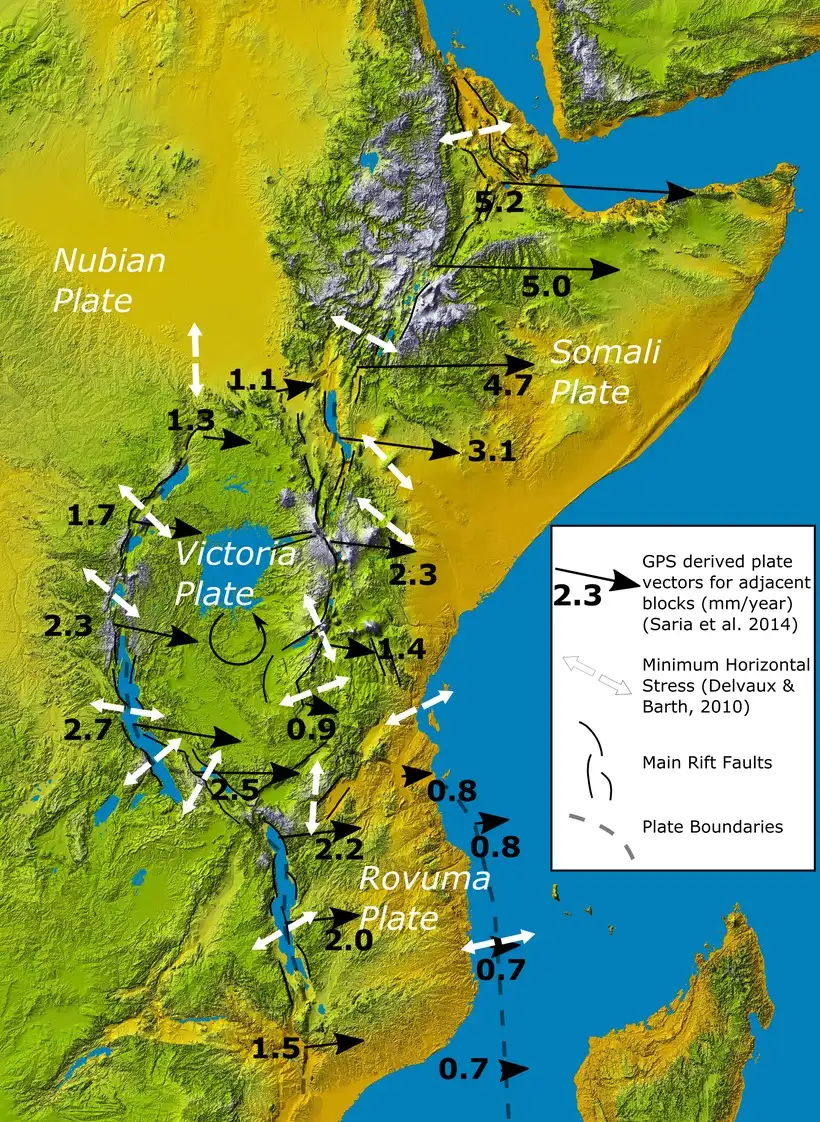
GPS motion between the Nubian, Somali and smaller plates of East Africa, in millimetres a year, after Saria and others (2014). Map: Mikenorton, after Saria et al. (2014), CC BY-SA 4.0 (creativecommons.org/licenses/by-sa/4.0), via Wikimedia Commons. Resized. 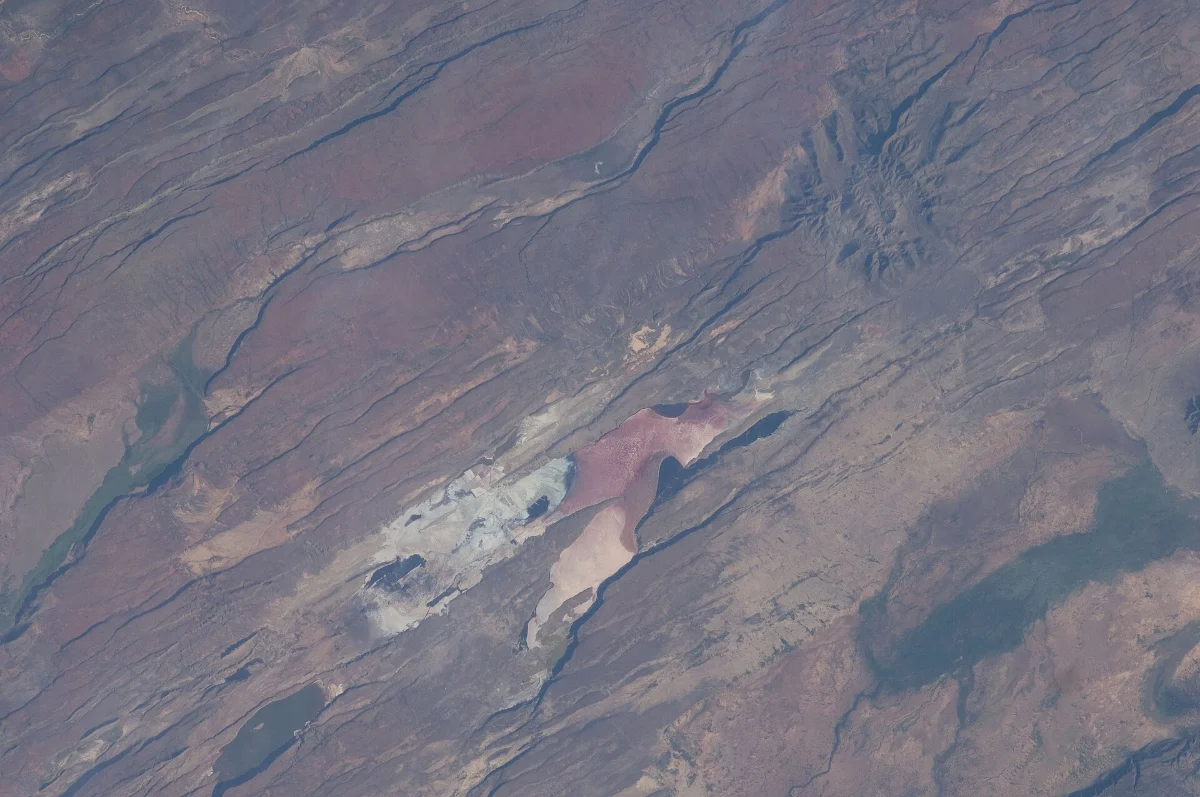
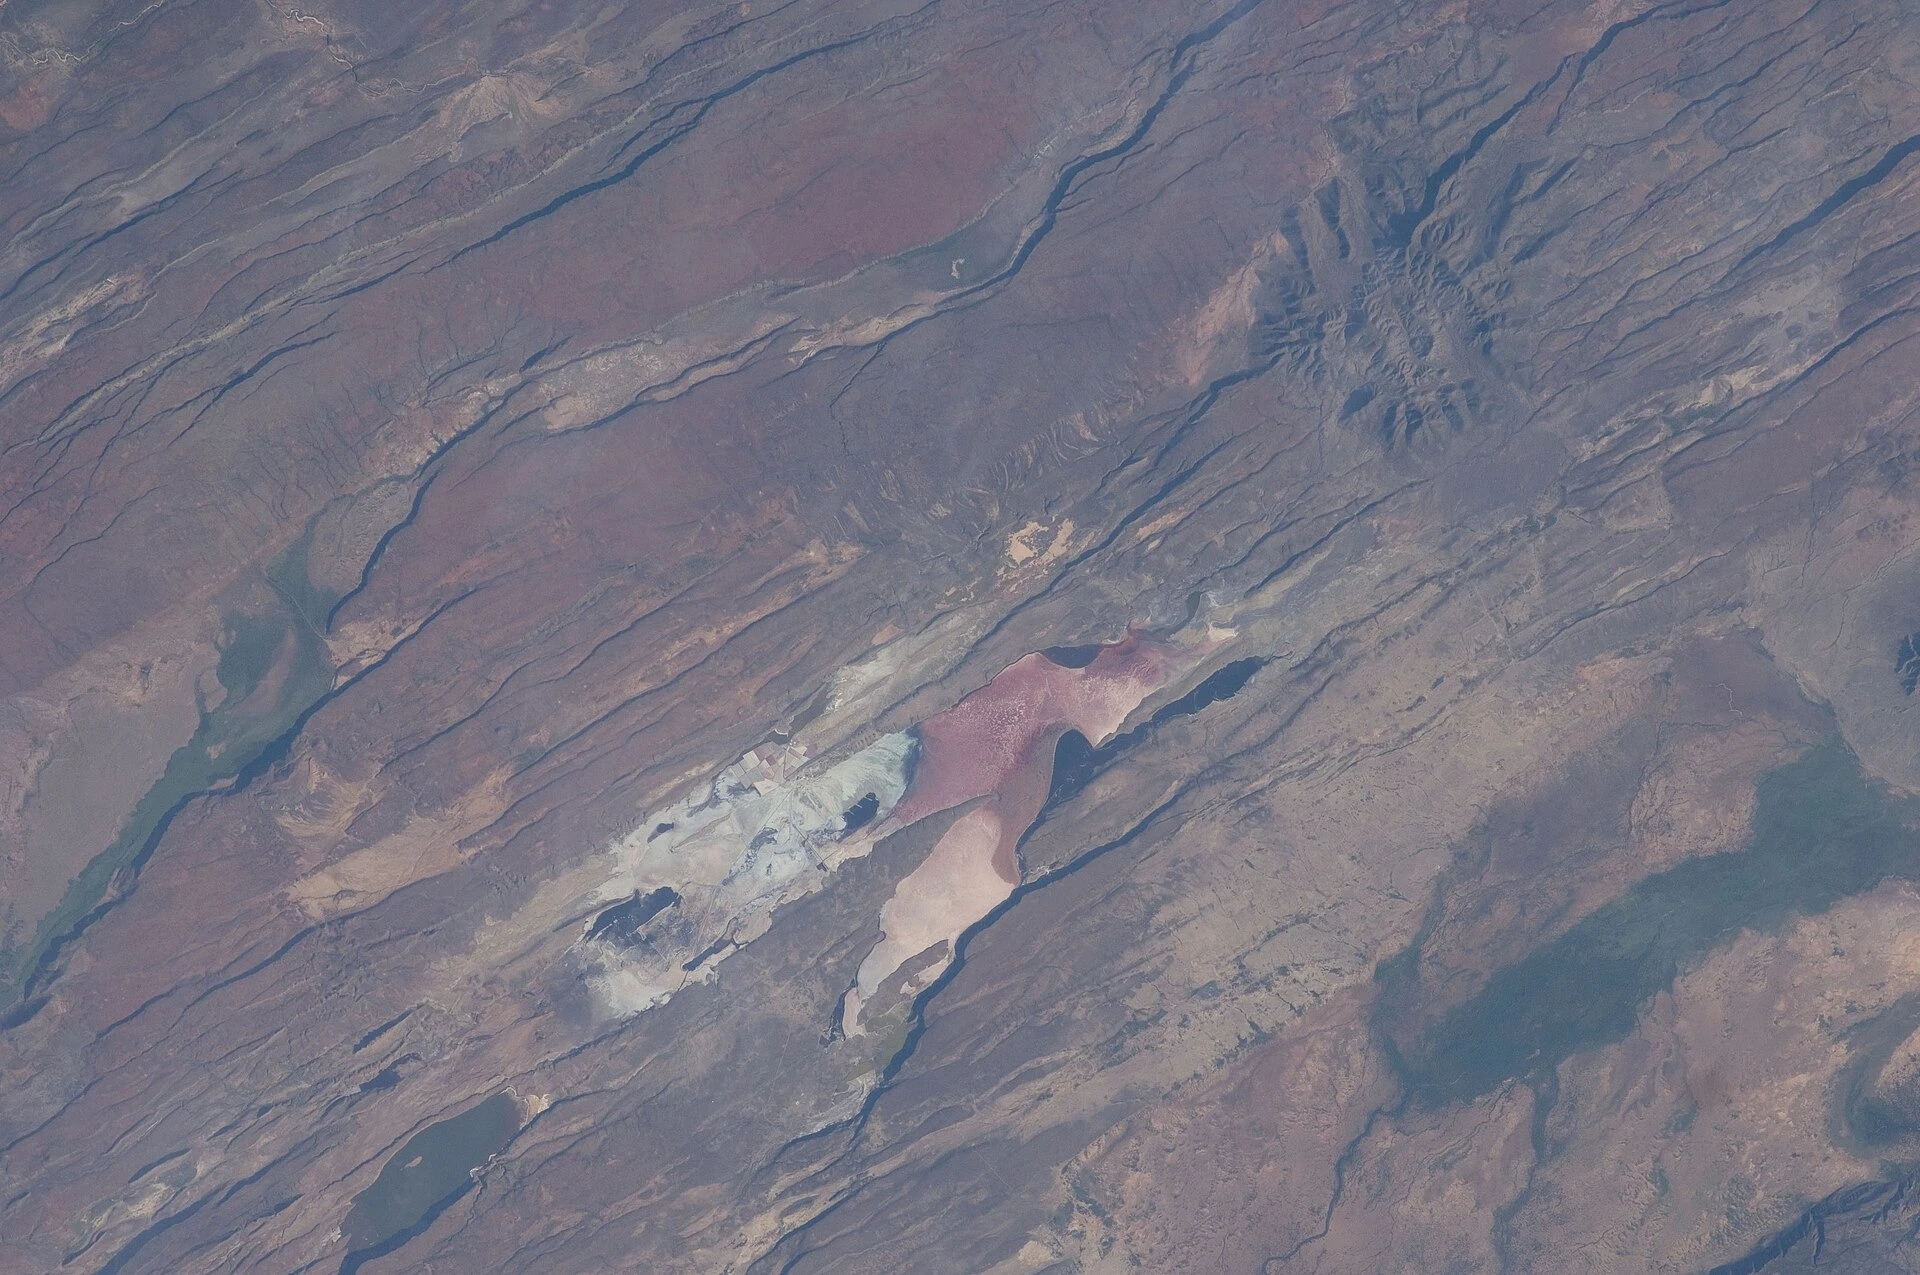
The East African Rift Valley in Kenya, photographed from the International Space Station by the Expedition 30 crew. Photo: NASA, ISS Expedition 30 crew, public domain, via Wikimedia Commons. Resized. 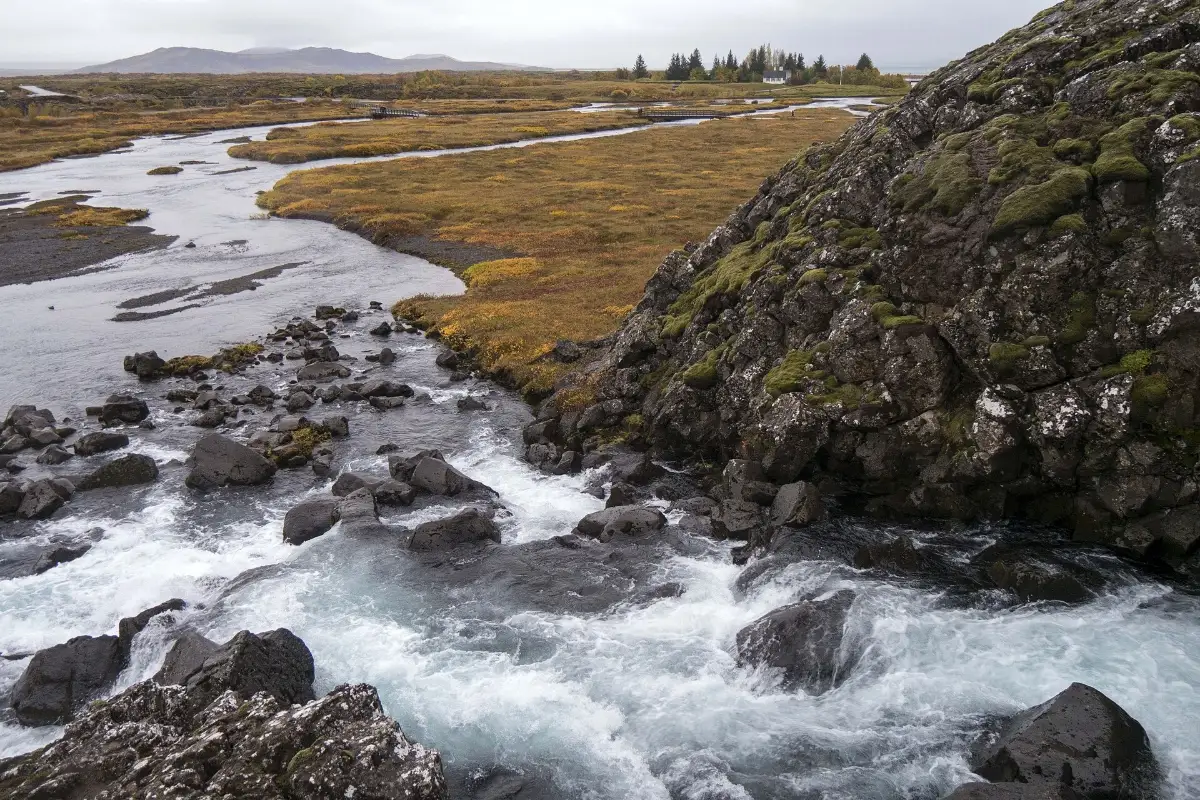
Thingvellir, Iceland, where the Mid-Atlantic Ridge comes ashore and the North American and Eurasian plates draw apart. Photo: Bryan Ledgard, CC BY 2.0 (creativecommons.org/licenses/by/2.0), via Wikimedia Commons. Resized. 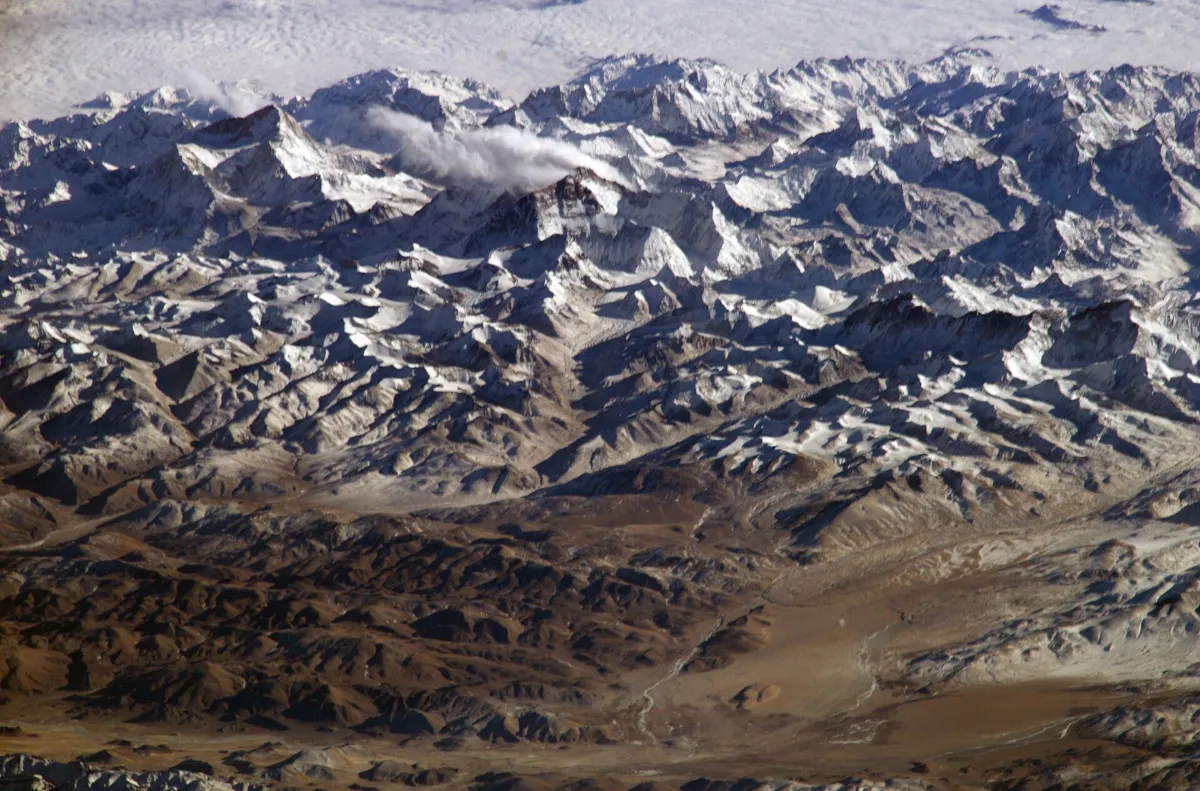
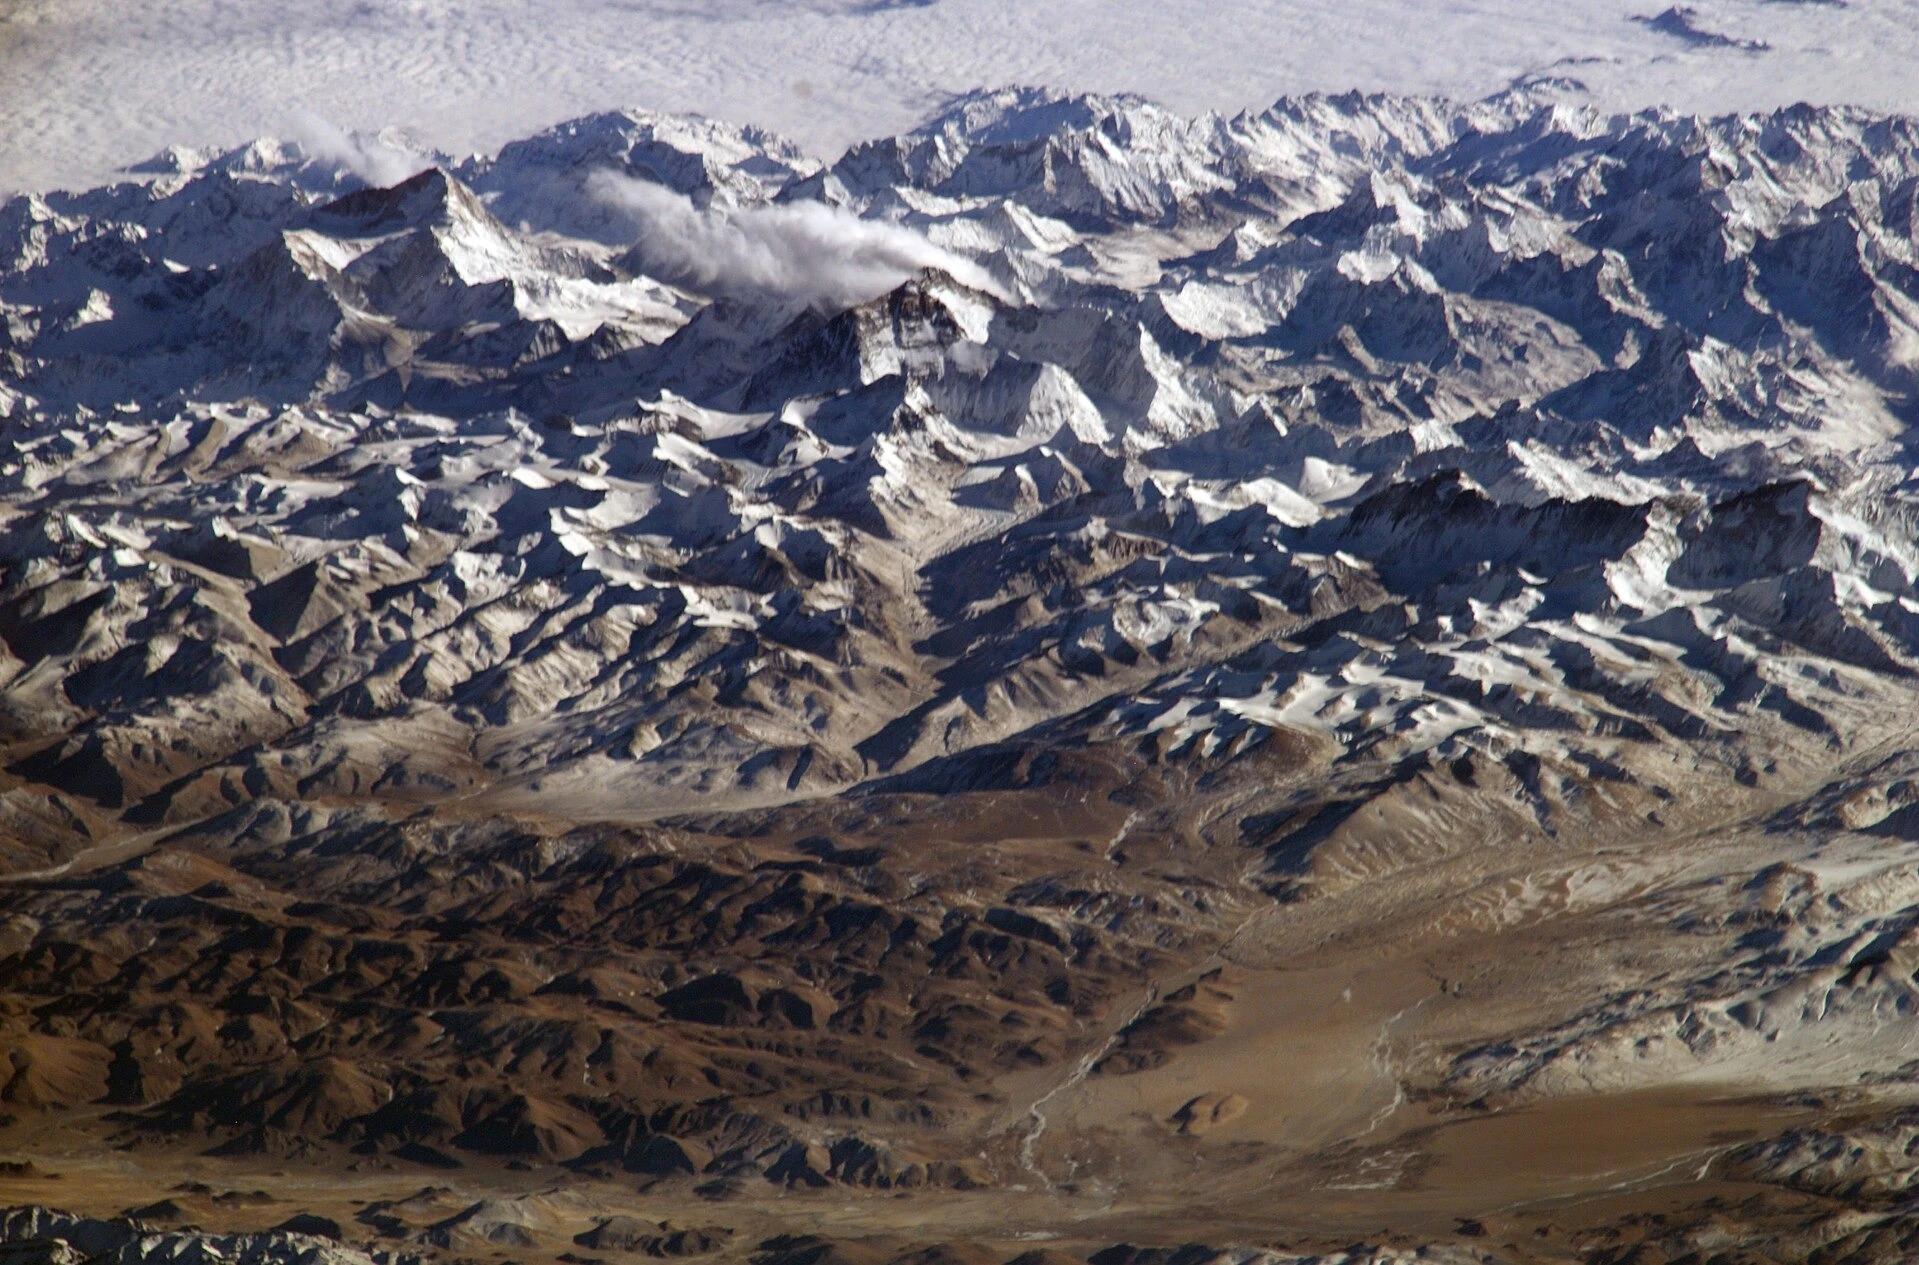
The Himalaya from the International Space Station: the range rises where the Indian plate pushes into Asia. Photo: NASA, International Space Station, public domain, via Wikimedia Commons. Resized. 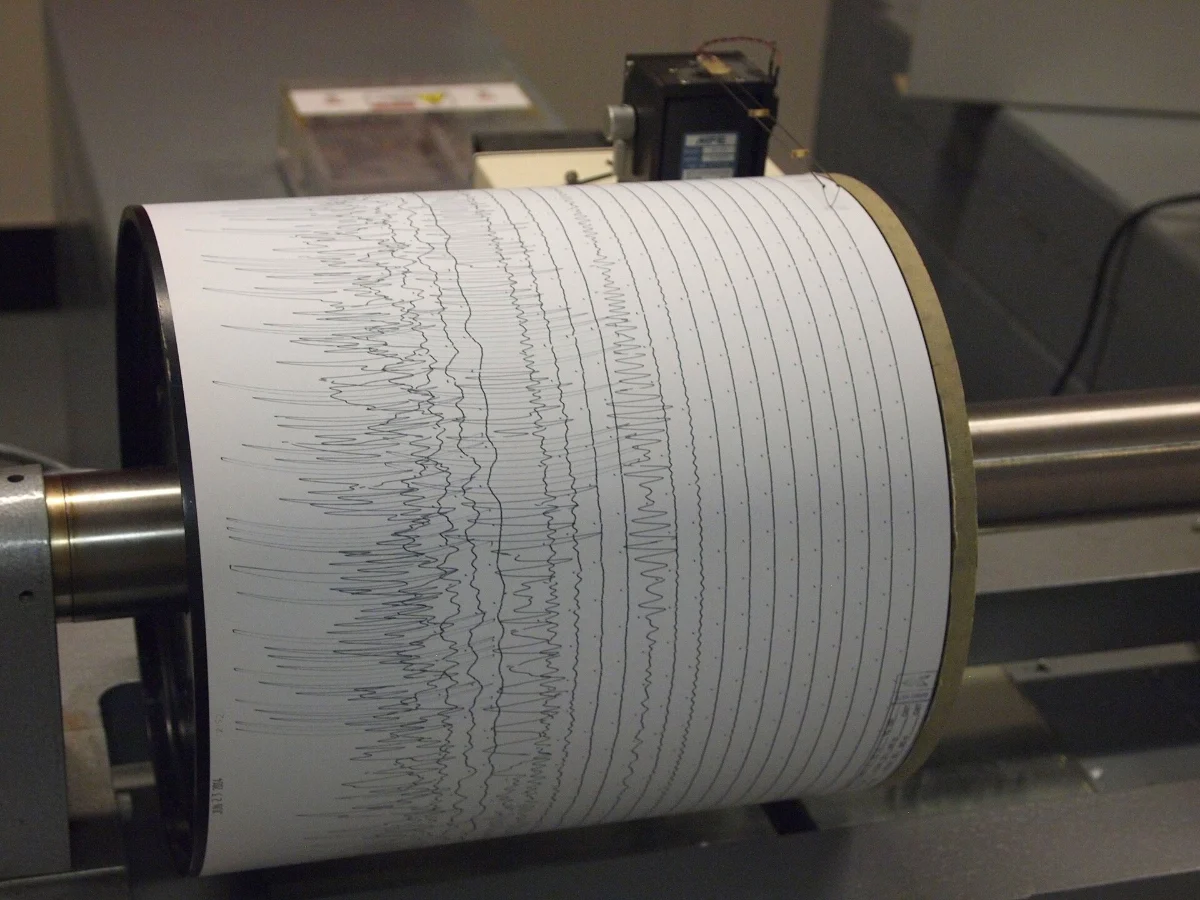
A seismograph drum recording at Weston Observatory, Massachusetts. Photo: Z22, CC BY-SA 3.0 (creativecommons.org/licenses/by-sa/3.0), via Wikimedia Commons. Resized. 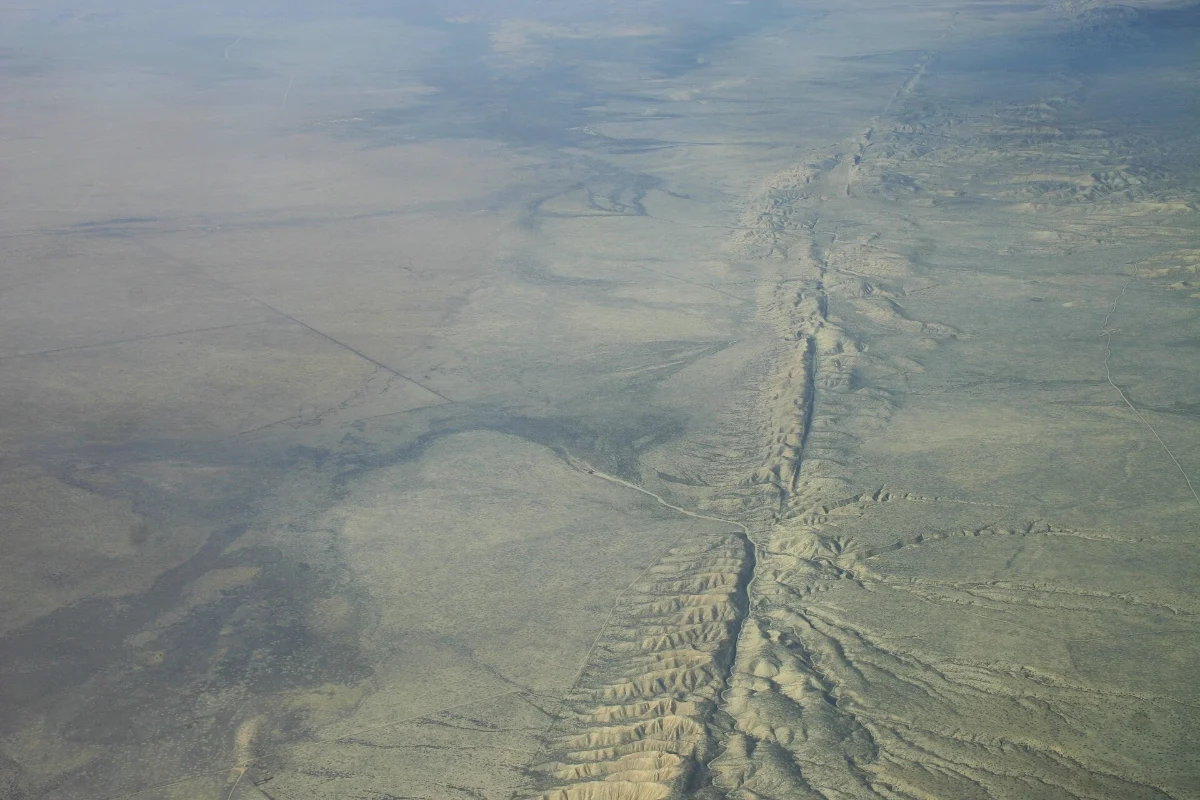
The San Andreas Fault across the Carrizo Plain, California, from the air in November 2007. Photo: Ikluft, CC BY-SA 4.0 (creativecommons.org/licenses/by-sa/4.0), via Wikimedia Commons. Resized. 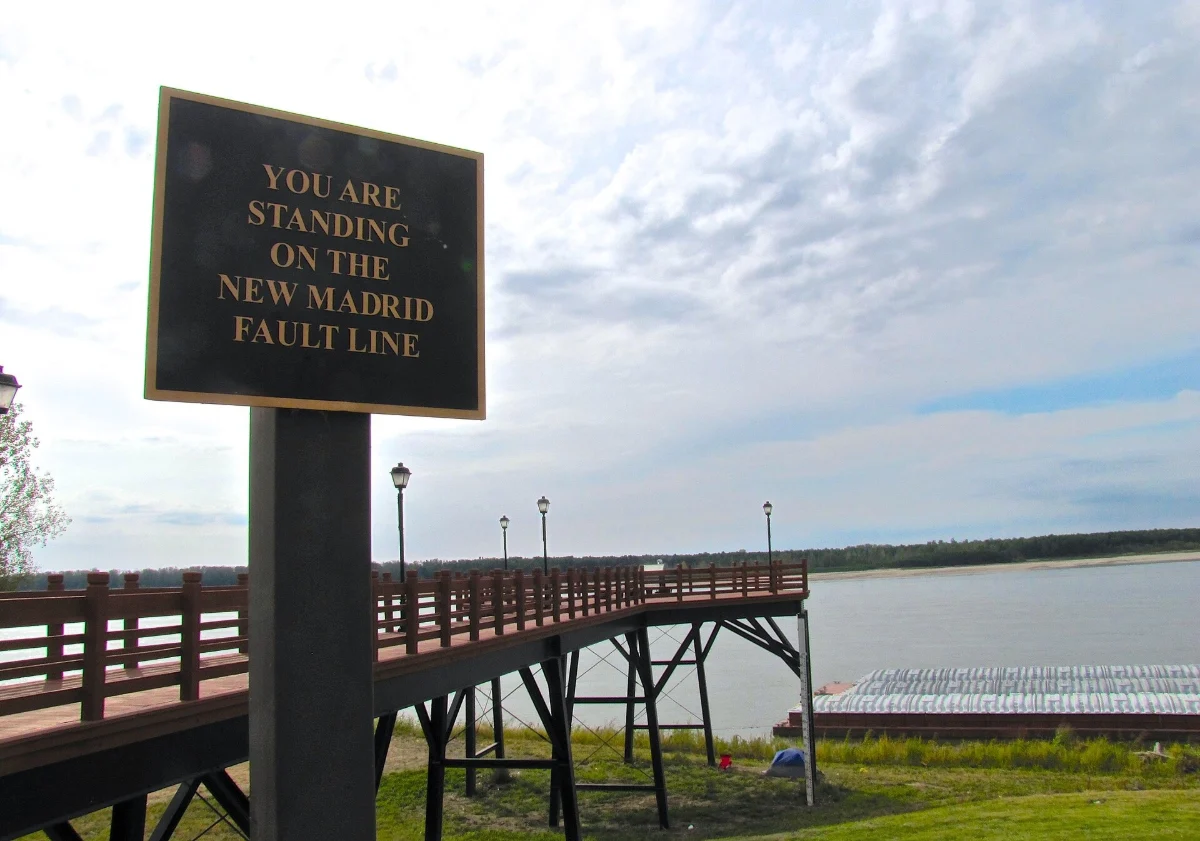
A sign in Missouri: 'You are standing on the New Madrid Fault Line.' Photo: Brian Stansberry, CC BY 4.0 (creativecommons.org/licenses/by/4.0), via Wikimedia Commons. Resized. 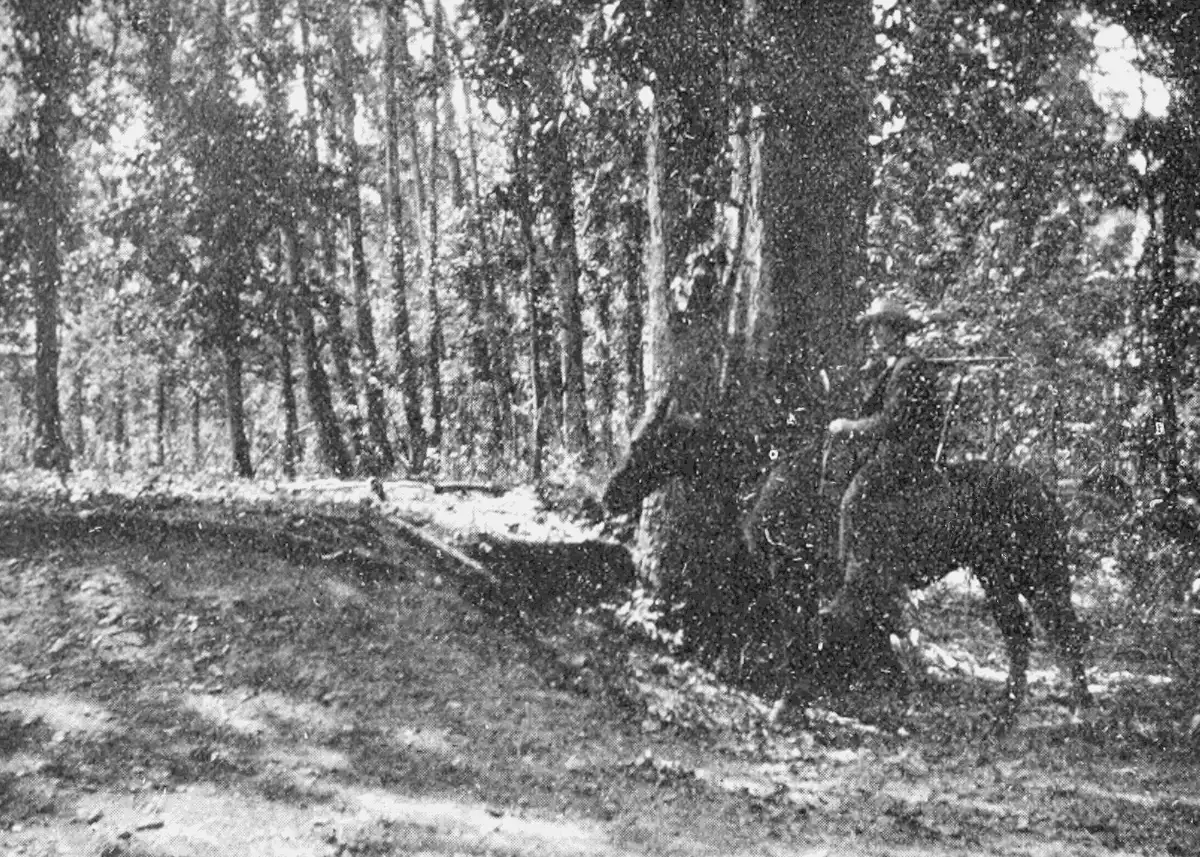
An earthquake crack still visible in the New Madrid region, photographed by M. L. Fuller and printed in 1906. Photo: M. L. Fuller, U.S. Geological Survey, in Popular Science Monthly vol. 69 (1906), public domain, via Wikimedia Commons.

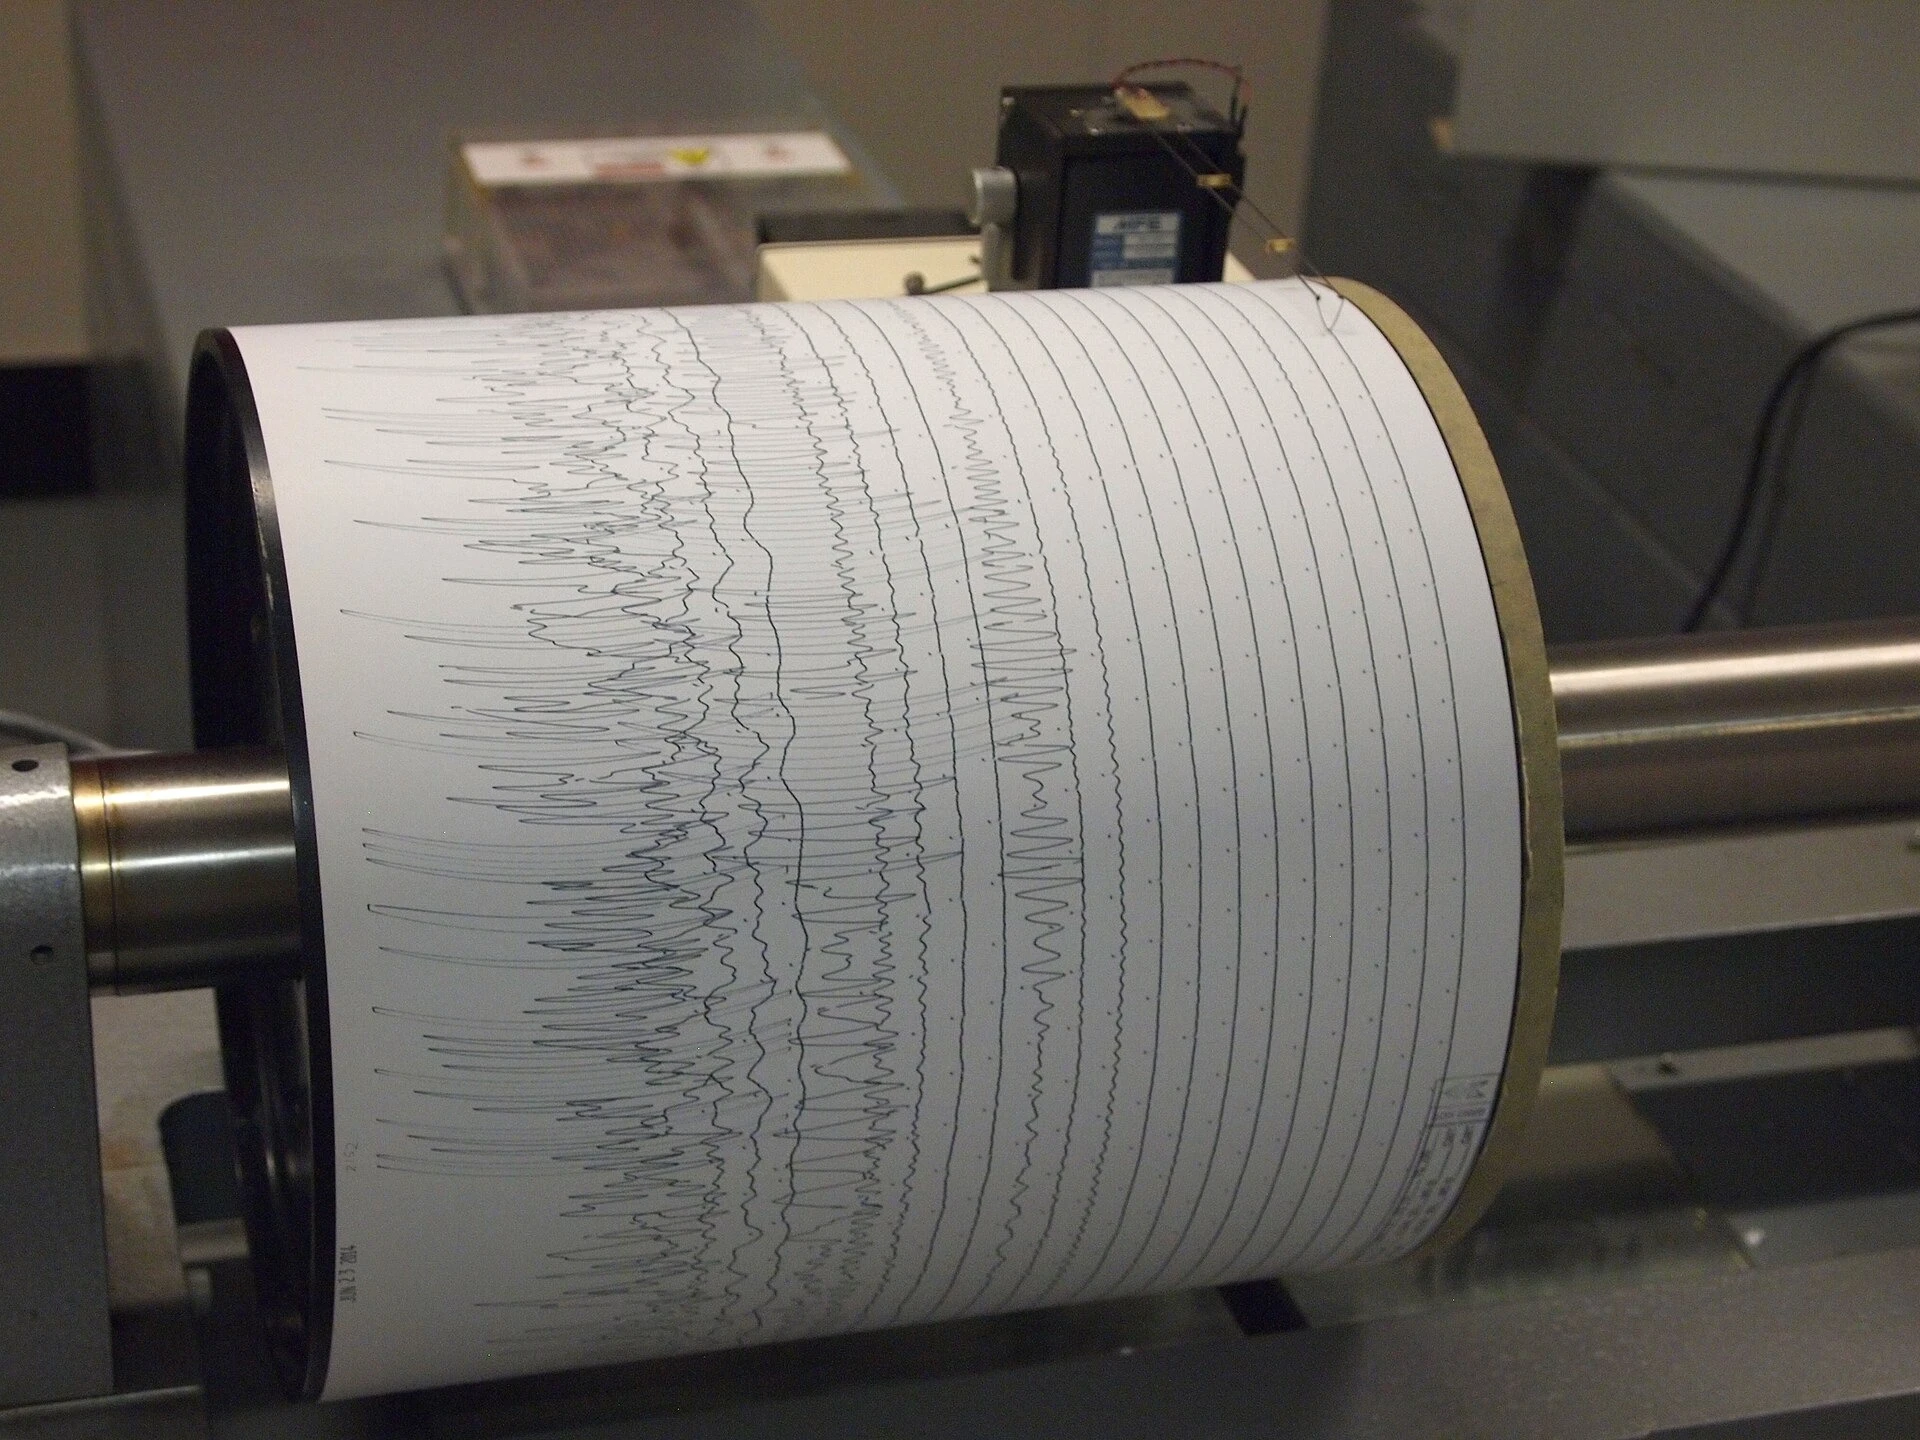
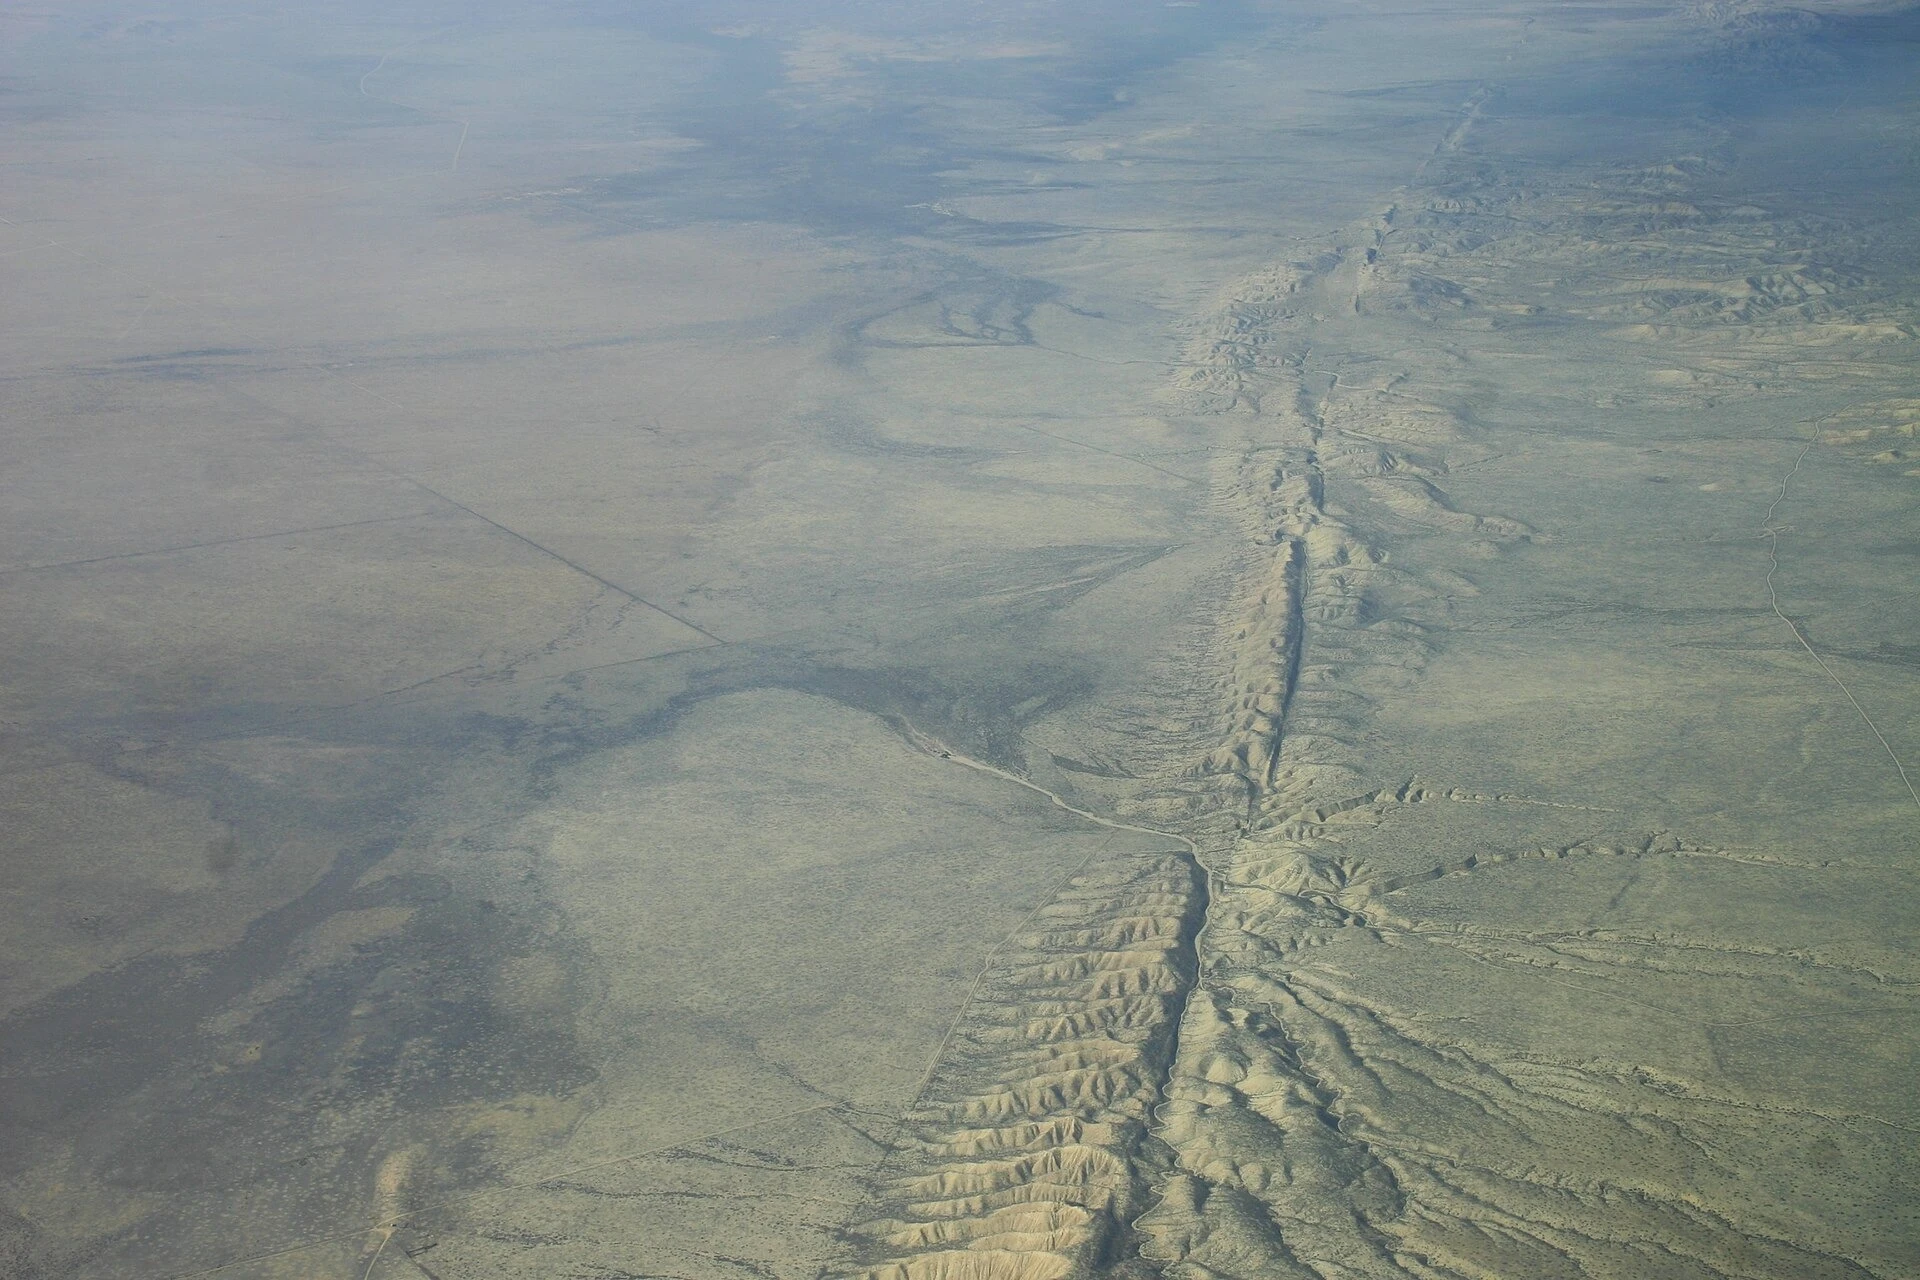
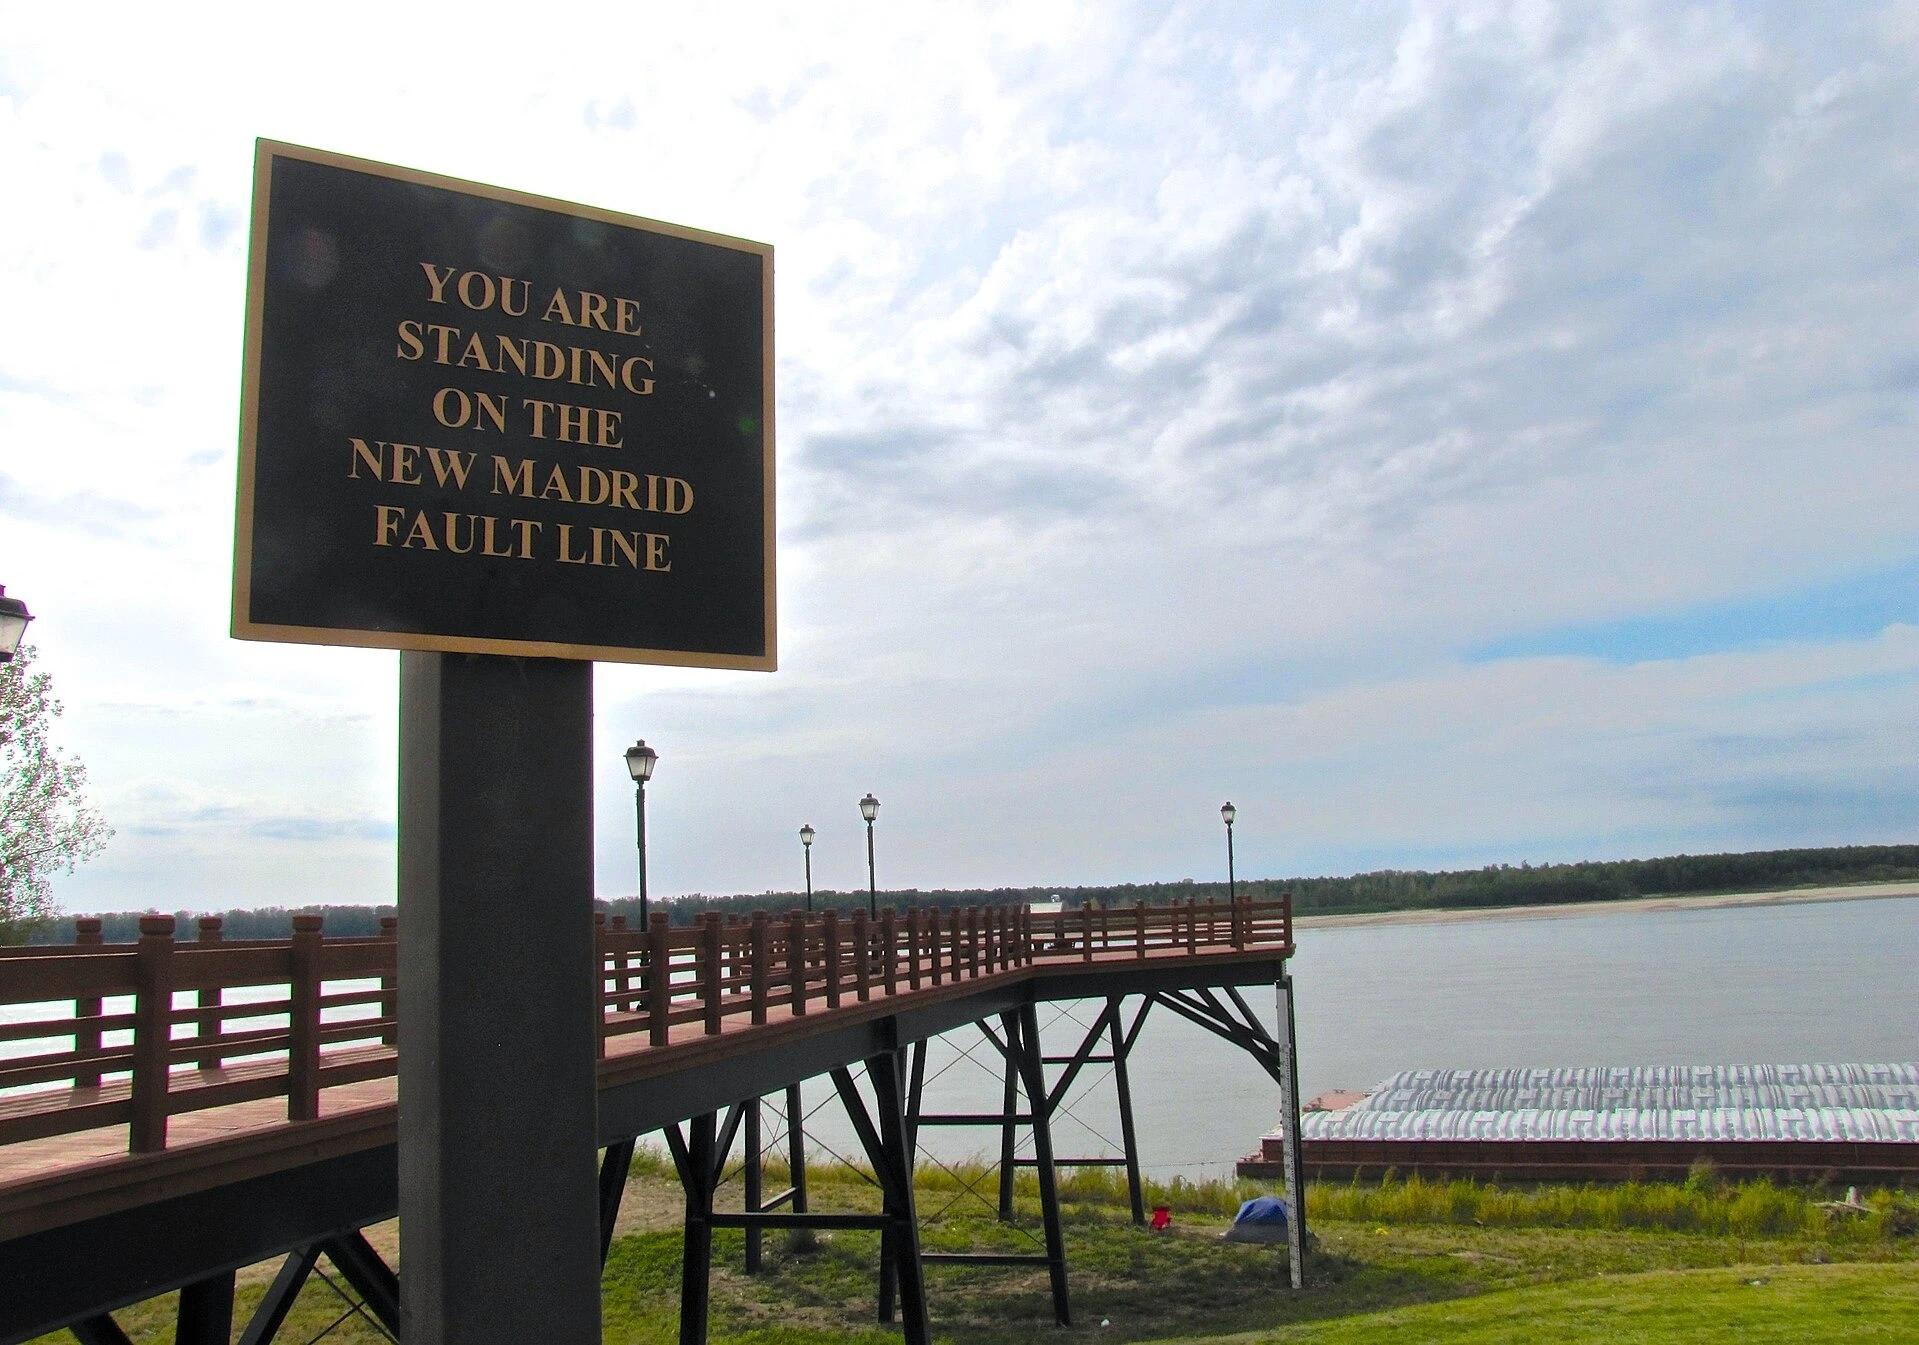
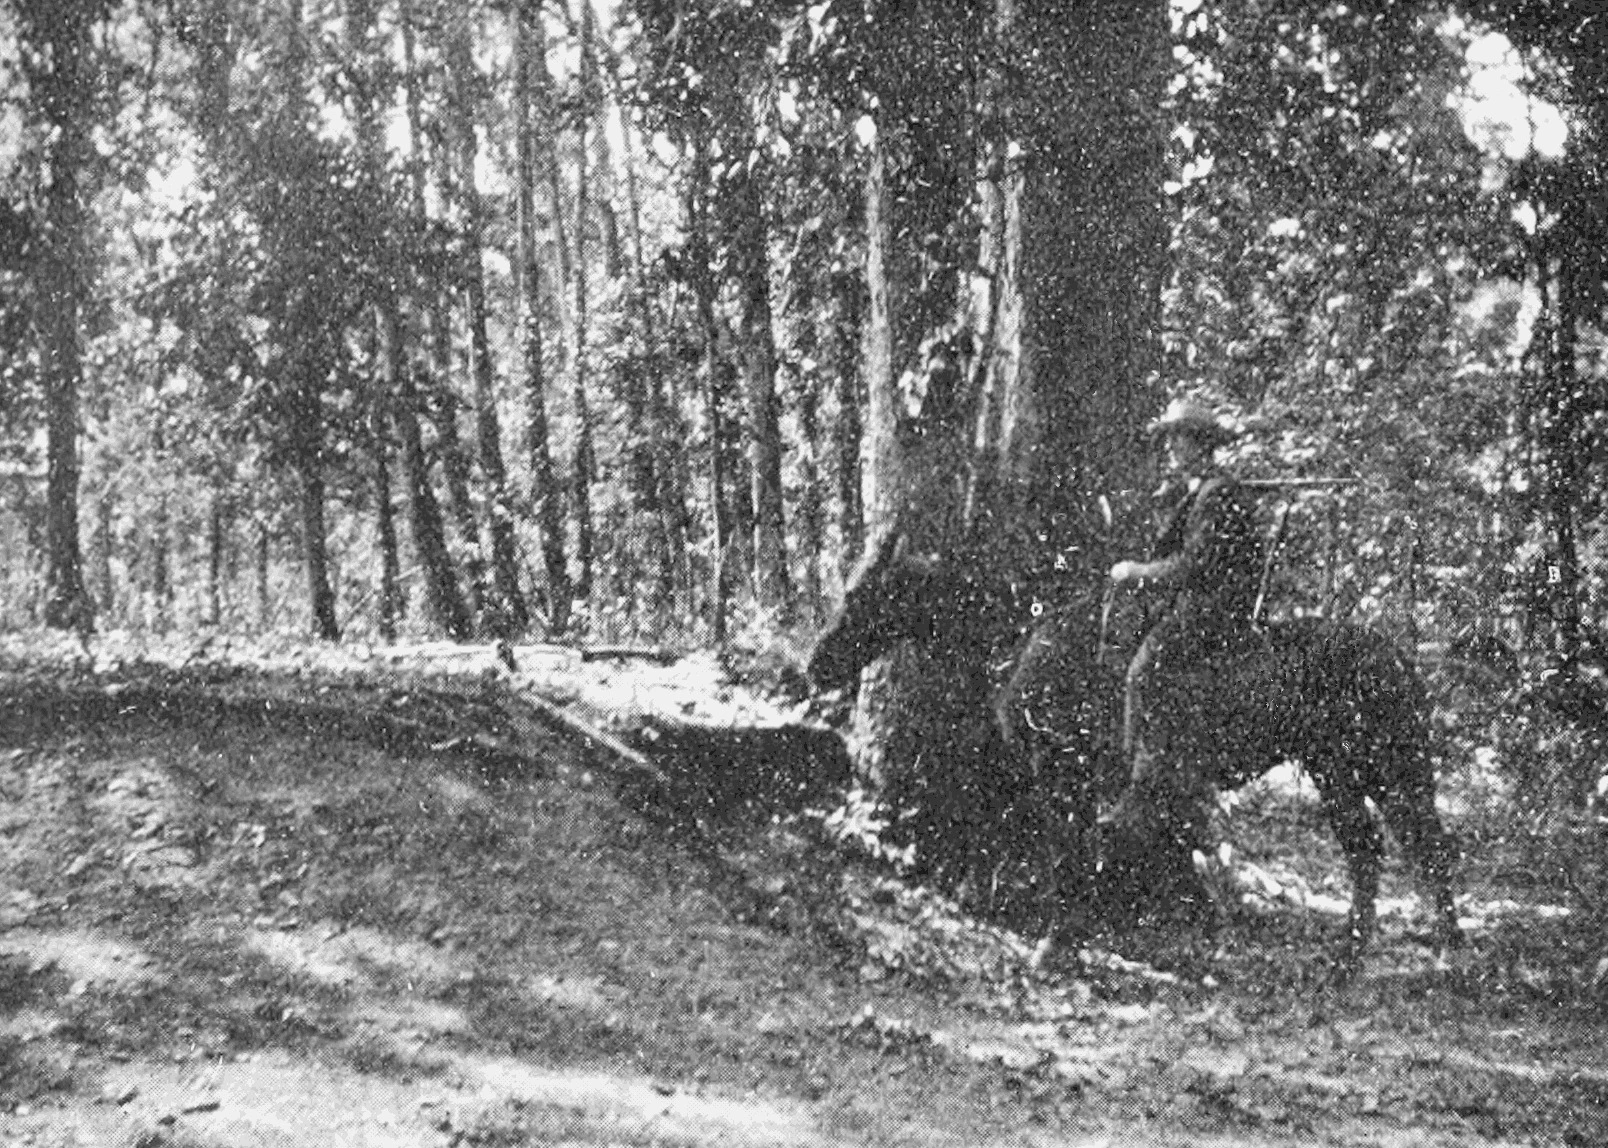
Select a photograph to see it full size, with its caption and credit.
Downloads
- Myron L. Fuller, The New Madrid Earthquake, USGS Bulletin 494, 1912 (full book, PDF)US Geological Survey, Government Printing Office; public domain (USGS: 'considered to be in the U.S. Public Domain')
Sources
- ZetaTalk: Scale of 1 to 10, written March 22, 2008 ZetaTalk (Nancy Lieder, for the Zetas) Primary record
- ZetaTalk: Nancy's Vision, written December 5, 2009 ZetaTalk (Nancy Lieder, for the Zetas) Primary record
- ZetaTalk: Are We at a 7 Yet?, November 28, 2009 ZetaTalk (Nancy Lieder, for the Zetas) Primary record
- ZetaTalk, written April 17, 2010 ZetaTalk (Nancy Lieder, for the Zetas) Primary record
- ZetaTalk: 7 of 10 Sequence, written October 16, 2010 ZetaTalk (Nancy Lieder, for the Zetas) Primary record
- ZetaTalk: Cause, written July 31, 2010 ZetaTalk (Nancy Lieder, for the Zetas) Primary record
- ZetaTalk: Detailed Information, written October 16, 2010 ZetaTalk (Nancy Lieder, for the Zetas) Primary record
- ZetaTalk: Plate Movements, written December 4, 2010 ZetaTalk (Nancy Lieder, for the Zetas) Primary record
- ZetaTalk: Japan Quakes, 2010 ZetaTalk (Nancy Lieder, for the Zetas) Primary record
- ZetaTalk: Tsunami, written May 1, 2010 ZetaTalk (Nancy Lieder, for the Zetas) Primary record
- ZetaTalk: One Big Jolt, written July 10, 2010 ZetaTalk (Nancy Lieder, for the Zetas) Primary record
- ZetaTalk: Skpetical, written October 16, 2010 ZetaTalk (Nancy Lieder, for the Zetas) Primary record
- ZetaTalk: Angry, written December 18, 2010 ZetaTalk (Nancy Lieder, for the Zetas) Primary record
- ZetaTalk: 7 of 10 Begins, December 25, 2010 ZetaTalk (Nancy Lieder, for the Zetas) Primary record
- ZetaTalk: Sumatra, January 4, 2011 ZetaTalk (Nancy Lieder, for the Zetas) Primary record
- ZetaTalk: Philippines Sinks, January 8, 2011 ZetaTalk (Nancy Lieder, for the Zetas) Primary record
- ZetaTalk: Queensland, January 8, 2011 ZetaTalk (Nancy Lieder, for the Zetas) Primary record
- ZetaTalk: 7 of 10 summary page ZetaTalk (site summary) Primary record
- ZetaTalk: Slower Pace, January 22, 2011 ZetaTalk (Nancy Lieder, for the Zetas) Primary record
- ZetaTalk, March 19, 2011 ZetaTalk (Nancy Lieder, for the Zetas) Primary record
- ZetaTalk: Humming Boxes, February 18, 2012 ZetaTalk (Nancy Lieder, for the Zetas) Primary record
- ZetaTalk: Pace Slowed, May 19, 2012 ZetaTalk (Nancy Lieder, for the Zetas) Primary record
- ZetaTalk: Timeline Anxiety, written June 10, 2014 ZetaTalk (Nancy Lieder, for the Zetas) Primary record
- ZetaTalk Newsletter issue 1026, August 2, 2026, Point of Passage ZetaTalk (Nancy Lieder, for the Zetas) Primary record
- ZetaTalk chat, February 2, 2013 ZetaTalk (Nancy Lieder, for the Zetas) Primary record
- ZetaTalk chat, March 7, 2015 ZetaTalk (Nancy Lieder, for the Zetas) Primary record
- ZetaTalk chat, November 30, 2019 ZetaTalk (Nancy Lieder, for the Zetas) Primary record
- ZetaTalk chat, December 31, 2020 ZetaTalk (Nancy Lieder, for the Zetas) Primary record
- ZetaTalk chat, November 30, 2021 ZetaTalk (Nancy Lieder, for the Zetas) Primary record
- ZetaTalk chat, March 31, 2022 ZetaTalk (Nancy Lieder, for the Zetas) Primary record
- ZetaTalk chat, April 30, 2022 ZetaTalk (Nancy Lieder, for the Zetas) Primary record
- ZetaTalk chat, May 31, 2023 ZetaTalk (Nancy Lieder, for the Zetas) Primary record
- ZetaTalk chat, December 31, 2023 ZetaTalk (Nancy Lieder, for the Zetas) Primary record
- ZetaTalk chat, September 30, 2025 ZetaTalk (Nancy Lieder, for the Zetas) Primary record
- ZetaTalk chat, March 31, 2025 ZetaTalk (Nancy Lieder, for the Zetas) Primary record
- ZetaTalk chat, July 2026 ZetaTalk (Nancy Lieder, for the Zetas) Primary record
- How fast do tectonic plates move? US Geological Survey Study
- W. J. Kious and R. I. Tilling, This Dynamic Earth, 1996, Understanding plate motions US Geological Survey (public domain, free full text) Study
- W. J. F. Simons and others, A decade of GPS in Southeast Asia, Journal of Geophysical Research, 2007 American Geophysical Union Primary record
- H. Z. Abidin and others, On correlation between urban development, land subsidence and flooding phenomena in Jakarta, Proc. IAHS 370, 2015 Copernicus (CC BY 3.0) Primary record
- New Madrid fault system may be shutting down, March 13, 2009 (Calais and Stein, Science 323) Purdue University and Northwestern University, via EurekAlert Study
- A. D. Frankel and others, Earthquake hazard in the New Madrid Seismic Zone remains a concern, USGS Fact Sheet 2009-3071 US Geological Survey Primary record
- E. Calais, S. Stamps and others, Geodetic constraints on rifting processes in East Africa, EGU 2008 European Geosciences Union Primary record
- Why are we having so many earthquakes? US Geological Survey Study
- A. Earnest, C. P. Rajendran and others, Near-field observations on the co-seismic deformation of the 2004 Andaman-Sumatra earthquake, Current Science 89, 2005 Current Science (author copy, UC San Diego) Primary record
- Evaluation of the 2011 off the Pacific coast of Tohoku Earthquake, April 11, 2011 Headquarters for Earthquake Research Promotion, Japan Primary record
- ZetaTalk chat, April 30, 2024 ZetaTalk (Nancy Lieder, for the Zetas) Primary record
- ZetaTalk chat, December 31, 2025 ZetaTalk (Nancy Lieder, for the Zetas) Primary record
- G. Blewitt, W. C. Hammond and C. Kreemer, Harnessing the GPS data explosion for interdisciplinary science, Eos 99, 2018 American Geophysical Union Study
- Summary of 1811-1812 New Madrid Earthquakes Sequence US Geological Survey Study
- Myron L. Fuller, The New Madrid Earthquake, USGS Bulletin 494, 1912 (full book, PDF) US Geological Survey, Government Printing Office; public domain (USGS: 'considered to be in the U.S. Public Domain') Primary record